setLabelValue
Set label value in labeled signal set
Syntax
Description
setLabelValue(___,'LabelRowIndex',
specifies the row index, ridx)ridx, of an ROI or point label. The specified
value replaces the current value of that row. If you omit this argument, the function
appends ROI or point values to any existing label values.
setLabelValue(___,'SublabelRowIndex',
specifies the row index, sridx)sridx, of an ROI or point sublabel. The
specified value replaces the current value of that sublabel row.
Examples
Load a labeled signal set containing recordings of whale songs.
load whales
lss
lss =
labeledSignalSet with properties:
Source: {2×1 cell}
NumMembers: 2
TimeInformation: "sampleRate"
SampleRate: 4000
Labels: [2×3 table]
Description: "Characterize wave song regions"
Use labelDefinitionsHierarchy to see a list of labels and sublabels.
Use setLabelValue to add data to the set.
Add a new label to the signal set, corresponding to the maximum value of each member.
theMax = signalLabelDefinition('Maximum', ...
    'LabelDataType','numeric', ...
    'Description','Maximum value of the signal');
addLabelDefinitions(lss,theMax)
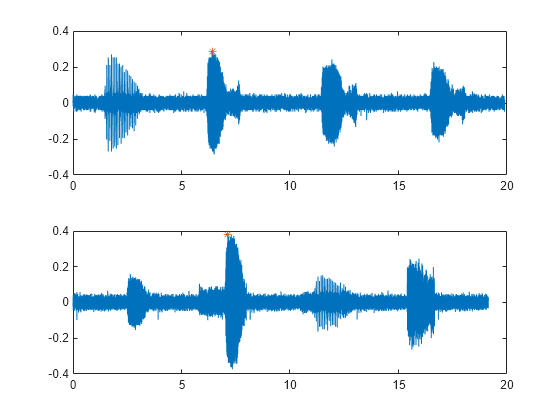
For each labeled signal, set the value of the new label to the signal maximum. Plot the signals and their maxima.
fs = lss.SampleRate;
for k = 1:lss.NumMembers
    sg = getSignal(lss,k);
    [mx,ix] = max(sg);

    setLabelValue(lss,k,'Maximum',mx)

    subplot(2,1,k)
    plot((0:length(sg)-1)/fs,sg,ix/fs,mx,'*')
end

Display the names and values of the labels in the set.
lbldefs = getLabelValues(lss)
lbldefs=2×4 table
                 WhaleType    MoanRegions    TrillRegions     Maximum
                 _________    ___________    ____________    __________

    Member{1}      blue       {3×2 table}    {1×3 table}     {[0.2850]}
    Member{2}      blue       {3×2 table}    {1×3 table}     {[0.3791]}
Decide that the signal maximum is better represented as a point label than as an attribute. Remove the numeric definition and redefine the maximum.
removeLabelDefinition(lss,'Maximum')
theMax = signalLabelDefinition('Maximum', ...
    'LabelType','point','LabelDataType','numeric', ...
    'Description','Maximum value of the signal');
addLabelDefinitions(lss,theMax)
For each labeled signal, set the value of the new label to the signal maximum.
for k = 1:lss.NumMembers
    sg = getSignal(lss,k);
    [mx,ix] = max(sg);
    setLabelValue(lss,k,'Maximum',ix/fs,mx)
end
Plot the signals and their maxima.
for k = 1:lss.NumMembers
    subplot(2,1,k)
    sg = getSignal(lss,k);
    peaks = getLabelValues(lss,k,'Maximum');
    plot((0:length(sg)-1)/fs,sg, ...
        peaks.Location,cell2mat(peaks.Value),'*')
end
Since R2025a
Label Gaussian atoms in the time-frequency domain using a time-frequency region-of-interest (ROI) label definition and spectrogram options.
Generate Signal and Visualize Spectrogram
Generate a signal that consists of a voltage-controlled oscillator and four Gaussian atoms. The signal is sampled at 14 kHz for 2 seconds. Plot the spectrogram of the signal.
Fs = 14000;
t = (0:1/Fs:2)';
st = 0.01;
gaussFun = @(A,x,mu,f) exp(-(x-mu).^2/(2*st^2)).*sin(2*pi*f.*x)*A';
atomTimeCenters = [0.2 0.5 1 1.75];
atomFreqCenters = [2 6 2 5]*1000;
s = gaussFun([1 1 1 1]/10,t,atomTimeCenters,atomFreqCenters);
x = vco(chirp(t+.1,0,t(end),3).*exp(-2*(t-1).^2),[0.1 0.4]*Fs,Fs);
s = s/10+x;

bt = 0.2;
tr = 0.05;
op = 99;
pspectrum(s,Fs,"spectrogram", ...
    Leakage=bt,TimeResolution=tr,OverlapPercent=op)
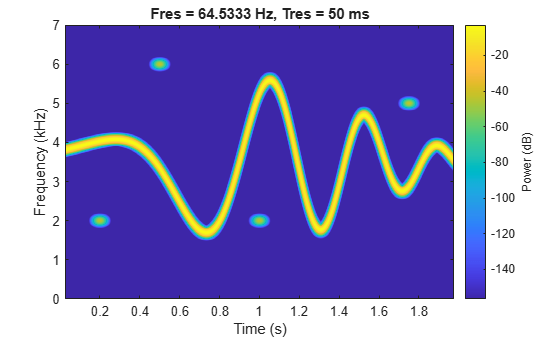
The spectrogram shows four patches in time-frequency domain that correspond with the Gaussian atoms. Define the times and frequencies for all the atoms.
atomTimes = atomTimeCenters'+[-st st]*5.5;
atomFreqs = atomFreqCenters'+[-1 1]*200;
Label Signal in Time-Frequency Domain
Create a logical time-frequency ROI label definition to label the Gaussian atoms. Specify spectrogram options with leakage properties.
opts = labelSpectrogramOptions("leakage", ...
    Leakage=40*(1-bt),Overlap=op, ...
    TimeResolutionMode="specify",TimeResolution=tr);

lblDef = signalLabelDefinition("Atom", ...
    LabelDataType="logical", ...
    LabelType="roiTimeFrequency",TimeFrequencyOptions=opts);
Create a labeled signal set from the signal and time-frequency ROI label definition.
lss = labeledSignalSet(s,lblDef,SampleRate=Fs);
Label the four atoms in time-frequency domain. Set the label values to true.
setLabelValue(lss,1,"Atom",atomTimes,atomFreqs,true(1,4))Visualize Time-Frequency Image and Label Mask
Create datastores from the labeled signal set for the time-frequency ROI label.
imSize = [512 768];
[sds,ads] = createDatastores(lss,"Atom", ...
    TimeFrequencyMapFormat="image", ...
    TimeFrequencyImageSize=imSize, ...
    TimeFrequencyLabelFormat="mask", ...
    TimeFrequencyMaskPriority=true);
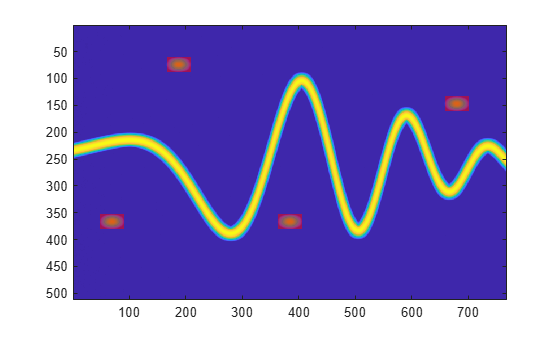
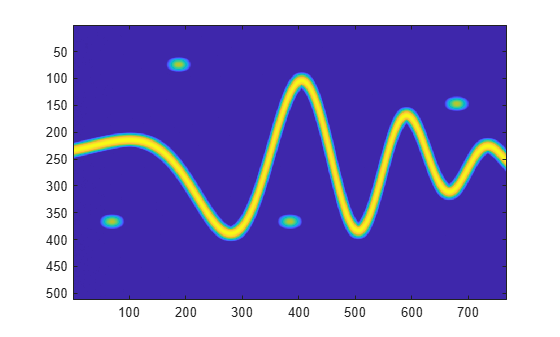
Read and show the time-frequency image.
imagesc(read(sds))
Read the label mask and display it above the time-frequency image.
lbl = read(ads);
im = zeros([imSize 3]);
im(:,:,1) = lbl{1};
hold on
imagesc(im,AlphaData=0.5*lbl{1})
hold off