signalLabelDefinition
R2026bCreate signal label definition
The signalLabelDefinition object has changed. For more information, see Version History.
Description
Use signalLabelDefinition to create signal label definitions for
data sets. The labels can correspond to attributes, regions, or points of interest. Use a
vector of signalLabelDefinition objects to create a labeledSignalSet.
Creation
Description
sld = signalLabelDefinition(name,PropertyName=Value)
Input Arguments
Properties
Object Functions
labelDefinitionsHierarchy | Get hierarchical list of label and sublabel names |
labelDefinitionsSummary | Get summary table of signal label definitions |
Examples
Consider a set of whale sound recordings. The recorded whale sounds consist of trills and moans. Trills sound like series of clicks. Moans are low-frequency cries similar to the sound made by a ship's horn. You want to look at each signal and label it to identify the whale type, the trill regions, and the moan regions. For each trill region, you also want to label the signal peaks higher than a certain threshold.
Signal Label Definitions
Define an attribute label to store whale types. The possible categories are blue whale, humpback whale, and white whale.
dWhaleType = signalLabelDefinition("WhaleType", ...
   LabelType="attribute", ...
   LabelDataType="categorical", ...
   Categories=["blue" "humpback" "white"], ...
   Description="Whale type");
Define a region-of-interest (ROI) label to capture moan regions. Define another ROI label to capture trill regions.
dMoans = signalLabelDefinition("MoanRegions", ...
   LabelType="roi", ...
   LabelDataType="logical", ...
   Description="Regions where moans occur");

dTrills = signalLabelDefinition("TrillRegions", ...
   LabelType="roi", ...
   LabelDataType="logical", ...
   Description="Regions where trills occur");
Finally, define a point label to capture the trill peaks. Set this label as a sublabel of the dTrills definition.
dTrillPeaks = signalLabelDefinition("TrillPeaks", ...
   LabelType="point", ...
   LabelDataType="numeric", ...
   Description="Trill peaks");

dTrills.Sublabels = dTrillPeaks;
Labeled Signal Set
Create a labeledSignalSet with the whale signals and the label definitions. Add label values to identify the whale type, the moan and trill regions, and the peaks of the trills.
load labelwhalesignals
lbldefs = [dWhaleType dMoans dTrills];

lss = labeledSignalSet({whale1 whale2},lbldefs, ...
    MemberNames=["Whale1" "Whale2"], ...
   SampleRate=Fs,Description="Characterize whale song regions");
Visualize the label hierarchy and label properties using labelDefinitionsHierarchy and labelDefinitionsSummary.
labelDefinitionsHierarchy(lss)
ans =
    'WhaleType
       Sublabels: []
     MoanRegions
       Sublabels: []
     TrillRegions
       Sublabels: TrillPeaks
     '
labelDefinitionsSummary(lss)
ans = 3×9 table
      LabelName        LabelType     LabelDataType     Categories     ValidationFunction    DefaultValue             Sublabels             Tag            Description
    ______________    ___________    _____________    ____________    __________________    ____________    ___________________________    ___    ____________________________

    "WhaleType"       "attribute"    "categorical"    {3×1 string}       {["N/A"   ]}       {0×0 double}    {0×0 double               }    ""     "Whale type"
    "MoanRegions"     "roi"          "logical"        {["N/A"   ]}       {0×0 double}       {0×0 double}    {0×0 double               }    ""     "Regions where moans occur"
    "TrillRegions"    "roi"          "logical"        {["N/A"   ]}       {0×0 double}       {0×0 double}    {1×1 signalLabelDefinition}    ""     "Regions where trills occur"
The signals in the loaded data correspond to songs of two blue whales. Set the "WhaleType" values for both signals.
setLabelValue(lss,1,"WhaleType","blue");
setLabelValue(lss,2,"WhaleType","blue");
Visualize the Labels property. The table has the newly added "WhaleType" values for both signals.
lss.Labels
ans = 2×3 table
              WhaleType    MoanRegions    TrillRegions
              _________    ___________    ____________

    Whale1      blue       {0×2 table}    {0×3 table}
    Whale2      blue       {0×2 table}    {0×3 table}
Visualize Region Labels
Visualize the whale songs to identify the trill and moan regions.
tiledlayout("flow")
nexttile
plot((0:length(whale1)-1)/Fs,whale1)
ylabel("Whale 1")
nexttile
plot((0:length(whale2)-1)/Fs,whale2)
ylabel("Whale 2")
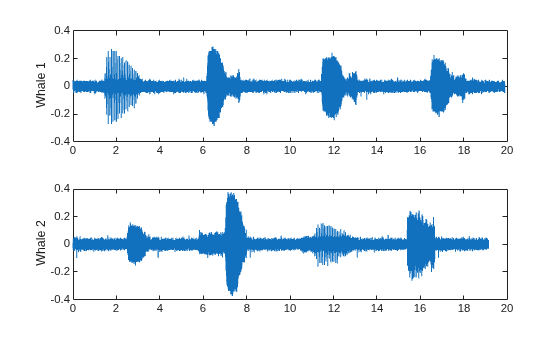
Moan regions are sustained low-frequency wails.
whale1has moans centered at about 7 seconds, 12 seconds, and 17 seconds.whale2has moans centered at about 3 seconds, 7 seconds, and 16 seconds.
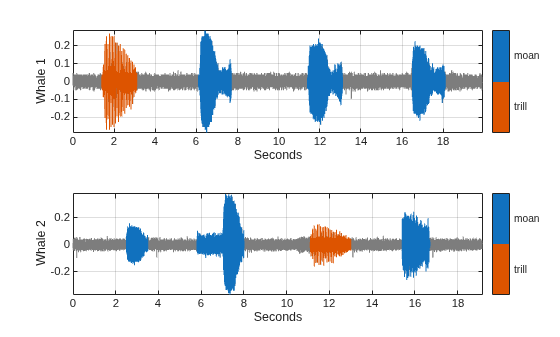
Add the moan regions to the labeled set. Specify the ROI limits in seconds and the label values.
moanRegionsWhale1 = [6.1 7.7; 11.4 13.1; 16.5 18.1];
mrsz1 = [size(moanRegionsWhale1,1) 1];
setLabelValue(lss,1,"MoanRegions",moanRegionsWhale1,true(mrsz1));

moanRegionsWhale2 = [2.5 3.5; 5.8 8; 15.4 16.7];
mrsz2 = [size(moanRegionsWhale2,1) 1];
setLabelValue(lss,2,"MoanRegions",moanRegionsWhale2,true(mrsz2));
Trill regions have distinct bursts of sound punctuated by silence.
whale1has a trill centered at about 2 seconds.whale2has a trill centered at about 12 seconds.
Add the trill regions to the labeled set.
trillRegionWhale1 = [1.4 3.1];
trsz1 = [size(trillRegionWhale1,1) 1];
setLabelValue(lss,1,"TrillRegions",trillRegionWhale1,true(trsz1));

trillRegionWhale2 = [11.1 13];
trsz2 = [size(trillRegionWhale1,1) 1];
setLabelValue(lss,2,"TrillRegions",trillRegionWhale2,true(trsz2));
Create a signalMask object for each whale song and use it to visualize and label the different regions. For better visualization, change the label values from logical to categorical.
mr1 = getLabelValues(lss,1,"MoanRegions");
mr1.Value = categorical(repmat("moan",mrsz1));
tr1 = getLabelValues(lss,1,"TrillRegions");
tr1.Value = categorical(repmat("trill",trsz1));

msk1 = signalMask([mr1;tr1],"SampleRate",Fs);

tiledlayout("flow")
ax1 = nexttile;
plotsigroi(msk1,whale1)
ylabel("Whale 1")
hold(ax1,"on")

mr2 = getLabelValues(lss,2,"MoanRegions");
mr2.Value = categorical(repmat("moan",mrsz2));
tr2 = getLabelValues(lss,2,"TrillRegions");
tr2.Value = categorical(repmat("trill",trsz2));

msk2 = signalMask([mr2;tr2],"SampleRate",Fs);

ax2 = nexttile;
plotsigroi(msk2,whale2)
ylabel("Whale 2")
hold(ax2,"on")
Visualize Point Labels
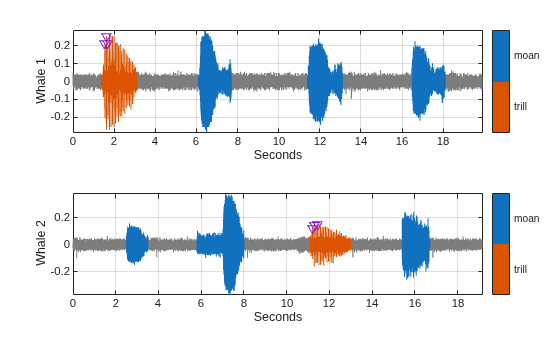
Label three peaks for each trill region. For point labels, you specify the point locations and the label values. In this example, the point locations are in seconds.
peakLocsWhale1 = [1.553 1.626 1.7];
peakValsWhale1 = [0.211 0.254 0.211];

setLabelValue(lss,1,["TrillRegions" "TrillPeaks"], ...
   peakLocsWhale1,peakValsWhale1,LabelRowIndex=1);

plot(ax1,peakLocsWhale1,peakValsWhale1,"v")
hold(ax1,"off")

peakLocsWhale2 = [11.214 11.288 11.437];
peakValsWhale2 = [0.119 0.14 0.15];

setLabelValue(lss,2,["TrillRegions" "TrillPeaks"], ...
   peakLocsWhale2,peakValsWhale2,LabelRowIndex=1);

plot(ax2,peakLocsWhale2,peakValsWhale2,"v")
hold(ax2,"off")
Explore Label Values
Explore the label values using getLabelValues.
getLabelValues(lss)
ans = 2×3 table
              WhaleType    MoanRegions    TrillRegions
              _________    ___________    ____________

    Whale1      blue       {3×2 table}    {1×3 table}
    Whale2      blue       {3×2 table}    {1×3 table}
Retrieve the moan regions for the first member of the labeled set.
getLabelValues(lss,1,"MoanRegions")ans = 3×2 table
ROILimits Value
____________ _____
6.1 7.7 {[1]}
11.4 13.1 {[1]}
16.5 18.1 {[1]}
Use a second output argument to list the sublabels of a label.
[value,valueWithSublabel] = getLabelValues(lss,1,"TrillRegions")value = 1×2 table
ROILimits Value
__________ _____
1.4 3.1 {[1]}
valueWithSublabel = 1×3 table
    ROILimits     Value     Sublabels
    __________    _____    ___________

                           TrillPeaks
                           ___________

    1.4    3.1    {[1]}    {3×2 table}
To retrieve the values in a sublabel, express the label name as a two-element array.
getLabelValues(lss,1,["TrillRegions","TrillPeaks"])
ans = 3×2 table
    Location      Value
    ________    __________

     1.553      {[0.2110]}
     1.626      {[0.2540]}
       1.7      {[0.2110]}
Find the value of the third trill peak corresponding to the second member of the set.
getLabelValues(lss,2,["TrillRegions" "TrillPeaks"], ...
    LabelRowIndex=1,SublabelRowIndex=3)
ans = 1×2 table
    Location      Value
    ________    __________

     11.437     {[0.1500]}
Specify the path to a set of audio signals included as MAT files with MATLAB®. Each file contains a signal variable and a sample rate. List the names of the files.
folder = fullfile(matlabroot,"toolbox","matlab","audiovideo");
lst = dir(append(folder,"/*.mat"));
nms = {lst(:).name}'
nms = 7×1 cell
    {'chirp.mat'   }
    {'gong.mat'    }
    {'handel.mat'  }
    {'laughter.mat'}
    {'mtlb.mat'    }
    {'splat.mat'   }
    {'train.mat'   }
Create a signal datastore that points to the specified folder. Set the sample rate variable name to Fs, which is common to all files. Generate a subset of the datastore that excludes the file mtlb.mat. Use the subset datastore as the source for a labeledSignalSet object.
sds = signalDatastore(folder,SampleRateVariableName="Fs");
sds = subset(sds,~strcmp(nms,"mtlb.mat"));
lss = labeledSignalSet(sds);
Create three label definitions to label the signals:
Define a logical attribute label that is true for signals that contain human voices.
Define a numeric point label that marks the location and amplitude of the maximum of each signal.
Define a categorical region-of-interest (ROI) label to pick out nonoverlapping, uniform-length random regions of each signal.
Add the signal label definitions to the labeled signal set.
vc = signalLabelDefinition("Voice",LabelType="attribute", ...
    LabelDataType="logical",DefaultValue=false);
mx = signalLabelDefinition("Maximum",LabelType="point", ...
    LabelDataType="numeric");
rs = signalLabelDefinition("RanROI",LabelType="ROI", ...
    LabelDataType="categorical",Categories=["ROI" "other"]);
addLabelDefinitions(lss,[vc mx rs])
Label the signals:
Label
'handel.mat'and'laughter.mat'as having human voices.Use the
islocalmaxfunction to find the maximum of each signal. Label its location and value.Use the
randROIfunction to generate as many regions of length N/10 samples as can fit in a signal of length N given a minimum separation of N/6 samples between regions. Label their locations and assign them to theROIcategory.
When labeling points and regions, convert sample values to time values. Subtract 1 to account for MATLAB array indexing and divide by the sample rate.
kj = 1;
while hasdata(sds)

    [sig,info] = read(sds);
    fs = info.SampleRate;

    [~,fn] = fileparts(info.FileName);
    if fn=="handel" || fn=="laughter"
        setLabelValue(lss,kj,"Voice",true)
    end

    xm = find(islocalmax(sig,MaxNumExtrema=1));
    setLabelValue(lss,kj,"Maximum",(xm-1)/fs,sig(xm))

    N = length(sig);
    rois = randROI(N,round(N/10),round(N/6));
    setLabelValue(lss,kj,"RanROI",(rois-1)/fs, ...
        repelem("ROI",size(rois,1)))

    kj = kj+1;

end
Verify that only two signals contain voices.
countLabelValues(lss,"Voice")ans = 2×3 table
Voice Count Percent
_____ _____ _______
false 4 66.667
true 2 33.333
Verify that two signals have a maximum amplitude of 1.
countLabelValues(lss,"Maximum")ans = 5×4 table
Maximum Count Percent MemberCount
______________________ _____ _______ ___________
0.80000000000000004441 1 16.667 1
0.89113331915798421612 1 16.667 1
0.94730769230769229505 1 16.667 1
1 2 33.333 2
1.0575668990330560071 1 16.667 1
Verify that each signal has four nonoverlapping random regions of interest.
countLabelValues(lss,"RanROI")ans = 2×4 table
RanROI Count Percent MemberCount
______ _____ _______ ___________
ROI 24 100 6
other 0 0 0
Create two datastores with the data in the labeled signal set:
The
signalDatastoreobjectsdcontains the signal data.The
arrayDatastoreobjectldcontains the labeling information. Specify that you want to include the information corresponding to all the labels you created.
[sd,ld] = createDatastores(lss,["Voice" "RanROI" "Maximum"]);
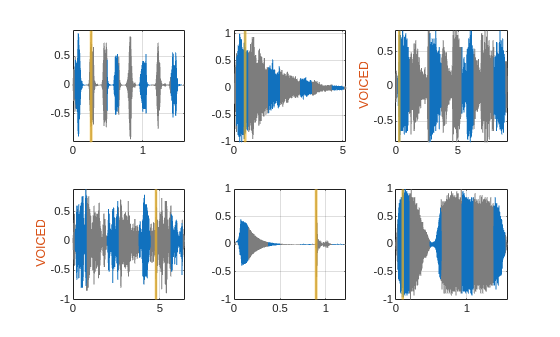
Use the information in the datastores to plot the signals and display their labels.
Use a
signalMaskobject to highlight the regions of interest in blue.Plot yellow lines to mark the locations of the maxima.
Add a red axis label to the signals that contain human voices.
tiledlayout flow

while hasdata(sd)

    [sg,nf] = read(sd);

    lbls = read(ld);

    nexttile

    msk = signalMask(lbls{:}.RanROI{:},SampleRate=nf.SampleRate);
    plotsigroi(msk,sg)
    colorbar off
    xlabel('')

    xline(lbls{:}.Maximum{:}.Location, ...
        LineWidth=2,Color="#EDB120")

    if lbls{:}.Voice{:}
        ylabel("VOICED",Color="#D95319")
    end

end
function roilims = randROI(N,wid,sep)

num = floor((N+sep)/(wid+sep));
hq = histcounts(randi(num+1,1,N-num*wid-(num-1)*sep),(1:num+2)-1/2);
roilims = (1 + (0:num-1)*(wid+sep) + cumsum(hq(1:num)))' + [0 wid-1];

end
Since R2025a
Label Gaussian atoms in the time-frequency domain using a time-frequency region-of-interest (ROI) label definition and spectrogram options.
Generate Signal and Visualize Spectrogram
Use the generateVCOsignalAndAtoms function to generate a signal that consists of a voltage-controlled oscillator and four Gaussian atoms. Generate the signal at a sample rate of 14 kHz for 2 seconds.
Fs = 14e3;
[s,atomTimes,atomFreqs] = generateVCOsignalAndAtoms(Fs,2);
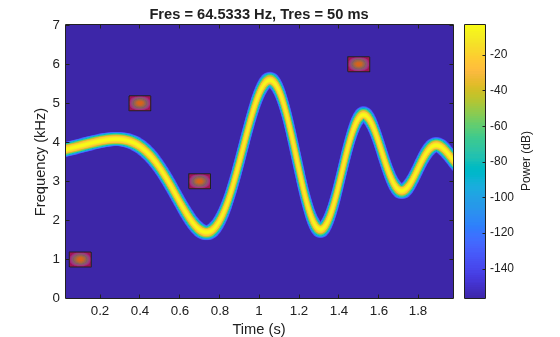
Plot the spectrogram of the third channel of the signal. Use a leakage parameter β of 0.2, a time resolution of 0.05 seconds, and a 99% overlap between adjoining segments. The spectrogram shows four patches that correspond with the Gaussian atoms.
betaLk = 0.2;
tResol = 0.05;
ovPerc = 99;

prefCh = 3;
X = atomTimes(:,:,prefCh);
Y = atomFreqs(:,:,prefCh);
pspectrum(s(:,prefCh),Fs,"spectrogram", ...
Leakage=betaLk,TimeResolution=tResol,OverlapPercent=ovPerc)
hold on
patch([X fliplr(X)]',[Y(:,1) Y Y(:,2)]'/1e3,"r",FaceAlpha=0.5)
hold off
Label Signal in Time-Frequency Domain
Create a logical time-frequency ROI label definition to label the Gaussian atoms. Specify spectrogram options with leakage properties.
opts = labelSpectrogramOptions("leakage", ...
    Leakage=40*(1-betaLk),Overlap=ovPerc, ...
    TimeResolutionMode="specify",TimeResolution=tResol);

lblDef = signalLabelDefinition("Atom",LabelDataType="logical", ...
    LabelType="roiTimeFrequency",TimeFrequencyOptions=opts, ...
    PreferredChannelMode="specify",PreferredChannels=prefCh);
Create a labeled signal set from the signal and time-frequency ROI label definition.
lss = labeledSignalSet(s,lblDef,SampleRate=Fs);
Label the four atoms in time-frequency domain. Set the label values to true.
setLabelValue(lss,1,"Atom",X,Y,true(1,4))Visualize Time-Frequency Image and Label Mask
Create datastores from the labeled signal set for the time-frequency ROI label.
imSize = [512 768];
[sds,ads] = createDatastores(lss,"Atom", ...
    TimeFrequencyMapFormat="image", ...
    TimeFrequencyImageSize=imSize, ...
    TimeFrequencyLabelFormat="mask", ...
    TimeFrequencyMaskPriority=true);
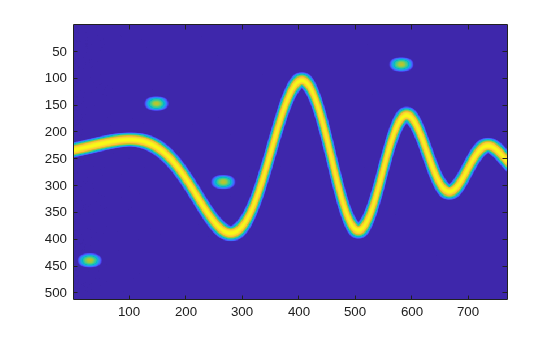
Read and show the time-frequency image.
imagesc(read(sds))
Read the label mask and display it above the time-frequency image.
lbl = read(ads);
im = zeros([imSize 3]);
im(:,:,1) = lbl{1};
hold on
imagesc(im,AlphaData=0.5*lbl{1})
hold off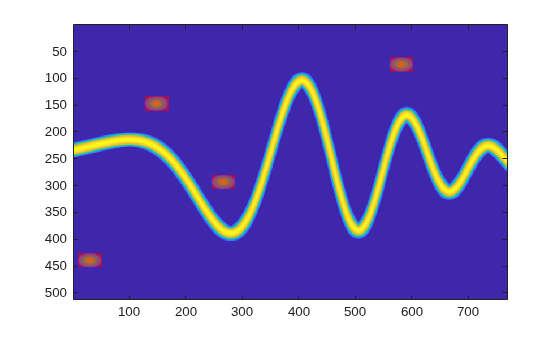
function [s,atomTimes,atomFreqs] = generateVCOsignalAndAtoms(Fs,tEnd)
    t = (0:1/Fs:tEnd)';
    st = 0.01;
    atc = [0.2 0.5 1 1.75; 0.3 0.8 1.2 1.5; 0.1 0.4 0.7 1.5];
    afc = [2 6 2 5; 3 4 1 2; 1 5 3 6]*1000;
    atCenters = permute(atc,[3 2 1]);
    afCenters = permute(afc,[3 2 1]);
    gaussFun = @(x,mu,fc) squeeze( ...
        sum(exp(-(x-mu).^2/(2*st^2)).*sin(2*pi*x.*fc),2));
    x = vco(chirp(t+0.1,0,t(end),3).*exp(-2*(t-1).^2),[0.1 0.4]*Fs,Fs);
    s = x + 0.01*gaussFun(t,atCenters,afCenters);
    atomTimes = permute(atCenters,[2 1 3]) + [-st/2 st/2]*5.5*tEnd;
    atomFreqs = permute(afCenters,[2 1 3]) + [-0.01 0.01]*5.5*Fs/4;
end

