key in values and plot in app designer

显示 更早的评论
i would like to make interactive calculator that looked like this.can some one help.i dont know how to link from the edit field to plot graph, or do i need to tabulate them first then plot?the calculation would be calculation of area under the curve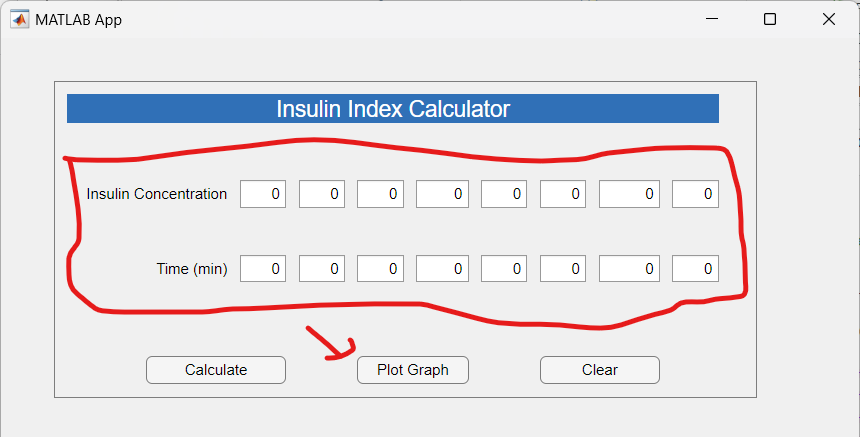
采纳的回答

Hi,
It seems like you're working on making an interactive calculator but are having trouble connecting the input fields with the graphical display (also referred to as the plot graph).
A possible way to resolve this is by using callback functions, these functions can be initiated in multiple ways, for example: when you press the "plot graph" button or even when you change the value in an input field. Here’s an example of the same:
- Create a ButtonPushed callback by clicking on the "plot" button.

- Make changes to the code according to the requirements.
% I have taken this code snippet from my app's app builder code editor.
properties (Access = private)
X
Y
end
% Callbacks that handle component events
methods (Access = private)
% Button pushed function: PlotButton
function plotAxis(app, event)
app.X = linspace(1, double(app.XEditField.Value), 100);
app.Y = linspace(1, double(app.YEditField.Value), 100);
plot(app.UIAxes, app.X, app.Y);
end
end
In the above example, a callback function is used which is initiated called when the “plot” button is clicked.

I hope this helps, thanks!
更多回答(0 个)
类别
在 帮助中心 和 File Exchange 中查找有关 2-D and 3-D Plots 的更多信息
Translated by 

