信息
此问题已关闭。 请重新打开它进行编辑或回答。
显示 更早的评论
Hey,
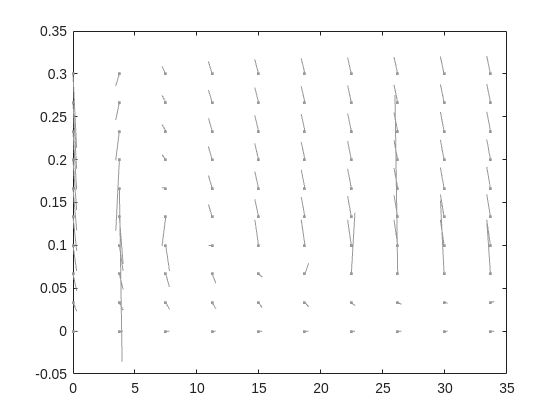
I'm trying to create an quiver plot, with equal arrow length but unequal axis lengths. Unfortunatly, the arrows do not want to scale down to the same, length...
Can someone help?
%% system paramters
eta = .1;
mu = .1;
nu = 1;
gamma = 2;
%% steady state
s_0 = (eta.^gamma + nu.^gamma)./((1-eta)*eta.^(gamma-1));
p_0 = eta./nu;
%% dependent variables
roi = 2;
s = linspace(max([(1-roi)*s_0,0]),(1+roi)*s_0,10);
p = linspace(max([(1-roi)*p_0,0]),(1+roi)*p_0,10);
[s,p] = meshgrid(s,p);
%% gradient flow
v = s.*p.^gamma ./ (1+(1+s).*p.^gamma);
ds = -v + eta;
dp = mu*(v - nu*p);
mag = sqrt(ds.^2 + dp.^2);
arrow_scale = 3E-1;
norm_ds = arrow_scale*ds./mag;
norm_dp = arrow_scale*dp./mag;
%% plot
q = quiver(s,p,norm_ds,norm_dp,'Autoscale','off', 'Color',.6*[1,1,1]);
q.ShowArrowHead = 'off';
q.Marker = '.';
0 个评论
回答(0 个)
此问题已关闭。
Community Treasure Hunt
Find the treasures in MATLAB Central and discover how the community can help you!
Start Hunting!
Translated by ![]()