3D plot from imported Excel data
采纳的回答
2 个评论
更多回答(3 个)
5 个投票
Your variable Z is still a column vector, since size(test,2) is 3 and thus the column index 3:size(test,2) is still just 3. You're replicating the vectors x and y to create a set of matrices X and Y when you use MESHGRID, and since z is still a vector, and not a matrix of the same size as X and Y, you can't plot a mesh.
This is a guess, but it sounds like what you actually have is a set of x, y, and z data that represent 3-D points scattered in space that lie on a surface. To plot this surface as a mesh, you have to define some sort of connectivity between them. There are a couple ways to do this:
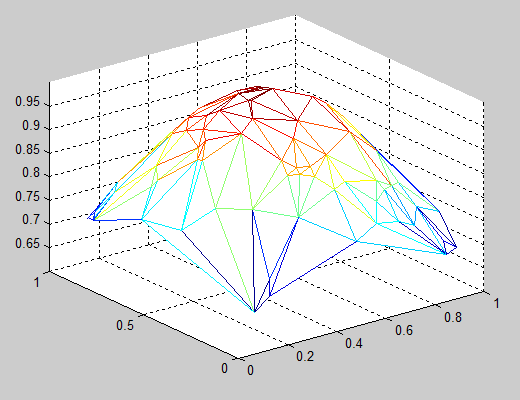
- Plot a triangular mesh: You can connect your x and y points into a 2-D triangular mesh using the function DELAUNAY, then plot a 3-D mesh using the function TRIMESH:
   x = rand(100,1);                  % Sample x data
   y = rand(100,1);                  % Sample y data
   z = exp(-(x-0.5).^2-(y-0.5).^2);  % Sample z data (a 2-D Gaussian)
   tri = delaunay(x,y);              % Create a 2-D triangular mesh
   trimesh(tri,x,y,z);               % Plot the mesh in 3-D
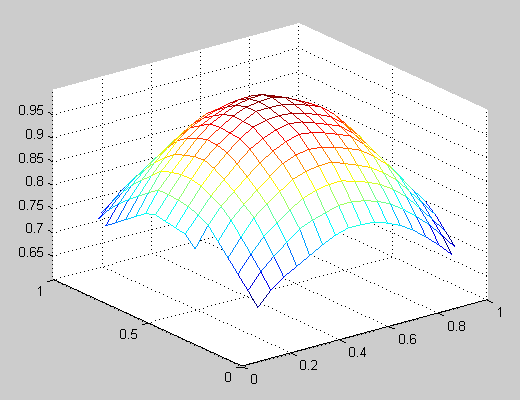
- Interpolate a regular mesh for your scattered points: You can use the TriScatteredInterp function to create an interpolant that you can evaluate at a given set of regularly spaced grid points, then plot the interpolated 3-D surface using the function MESH. Using the data from the example above:
   [X,Y] = meshgrid(linspace(0,1,20));  % Create a regular grid
   F = TriScatteredInterp(x,y,z);       % Create an interpolant
   Z = F(X,Y);   % Evaluate the interpolant at the grid points
   mesh(X,Y,Z);  % Plot the interpolated mesh
2 个投票
1 个投票
类别
在 帮助中心 和 File Exchange 中查找有关 Data Import from MATLAB 的更多信息
产品
Community Treasure Hunt
Find the treasures in MATLAB Central and discover how the community can help you!
Start Hunting!
Translated by ![]()