Hii Gabriel,
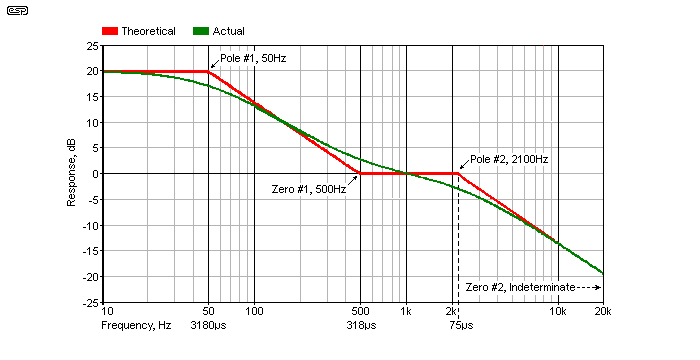
The bode plot of the equalizer circuit within the required frequency limits can be plotted by specifying the frequency range in the “bode” function call.The “bode” function have an argument to specify the frequency range for the bode plot.
The following code generates a Bode plot for the frequency range spanning from 10 Hz to 20 kHz.
% Define frequency range from 10 Hz to 20 kHz
freq_range = logspace(log10(10), log10(20000), 1000);
% Bode plot for H4 with specified frequency range
bode(H4, freq_range, options);
% Bode plot for H4min with specified frequency range
bode(H4min, freq_range, options);
Kindly refer to the below documentation of “bode plot”:


