Direct link to this entry


- /
-
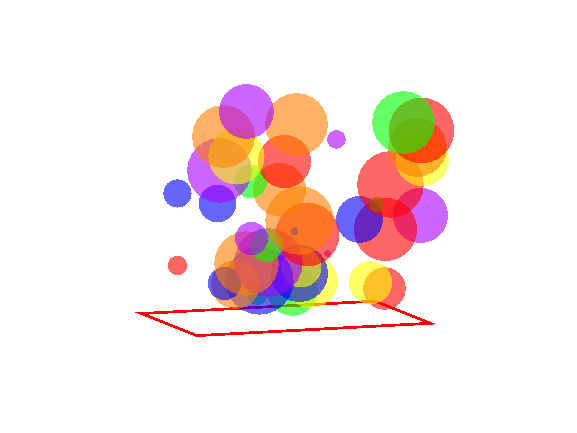
Bubble Up
on 12 Oct 2021
- 14
- 14
- 0
- 0
- 236
n=40;
x = rand(1,n);
y = rand(1,n);
z = x';
%rand(1,n);
sz = rand(1,n);
cc = prism(n+10);
c=cc(11:end,:);
bubblechart3(x,y,z,sz,c,'MarkerEdgeColor', 'none')
%set(h, 'MarkerFaceColor', 'none')
view(70,10)
light
hold
g=rectangle('Position',[0,0,1.1,0.9])
set(g,'EdgeColor',[1 0 0],'LineWidth',2 )
axis off


您也可以从以下列表中选择网站:
美洲
- América Latina (Español)
- Canada (English)
- United States (English)
欧洲
- Belgium (English)
- Denmark (English)
- Deutschland (Deutsch)
- España (Español)
- Finland (English)
- France (Français)
- Ireland (English)
- Italia (Italiano)
- Luxembourg (English)
- Netherlands (English)
- Norway (English)
- Österreich (Deutsch)
- Portugal (English)
- Sweden (English)
- Switzerland
- United Kingdom(English)
亚太
- Australia (English)
- India (English)
- New Zealand (English)
- 中国
- 日本Japanese (日本語)
- 한국Korean (한국어)