Direct link to this entry


- /
-
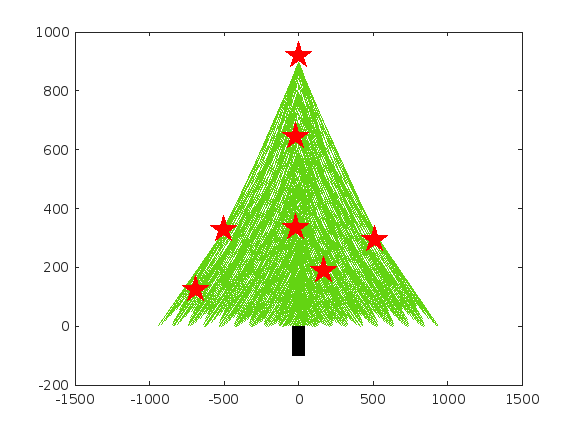
A Christmas tree
on 26 Oct 2022
- 4
- 12
- 0
- 0
- 280
t = linspace(0, 300*pi, 1000);
x = t.*cos(6*t).^3;
y = t.*sin(6*t).^2;
plot(x, y,'color',[0.39 0.83 0.07]);
hold on
plot([0 0],[-100 0],'color','k','linewidth',10)
plot([0 -23 -21 512 -690 -500 171],[920 646 334 295 123 327 190],'rp','markerfacecolor','r','markersize',20)
xlim([-1500 1500])
Remix Tree

您也可以从以下列表中选择网站:
美洲
- América Latina (Español)
- Canada (English)
- United States (English)
欧洲
- Belgium (English)
- Denmark (English)
- Deutschland (Deutsch)
- España (Español)
- Finland (English)
- France (Français)
- Ireland (English)
- Italia (Italiano)
- Luxembourg (English)
- Netherlands (English)
- Norway (English)
- Österreich (Deutsch)
- Portugal (English)
- Sweden (English)
- Switzerland
- United Kingdom (English)
亚太
- Australia (English)
- India (English)
- New Zealand (English)
- 中国
- 日本Japanese (日本語)
- 한국Korean (한국어)