


- /
-
pi digits
on 9 Oct 2024
- 8
- 120
- 0
- 3
- 621
i Cite your audio source here (if applicable):
drawframe(48);
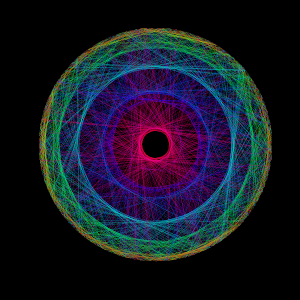
Write your drawframe function below
function drawframe(f)
nDigits = 2e3; % Number of digits to plot
digits(nDigits + 2); % Set precision for pi (extra digits for safety)
s = char(vpa(pi)); % Pi as a string with high precision
p = s(3:nDigits + 2) - '0'; % Convert pi digits to numerical array (digits after decimal)
% Calculate theta and radius values for polar plot
theta_base = 0:36:324; % Base theta values (1 x 10)
theta_offset = linspace(0, 36, nDigits); % Offsets from 0 to 36, row vector (1 x nDigits)
a = theta_base + theta_offset'; % Theta matrix of size (nDigits x 10)
% Index into 'a' using row indices 1:nDigits and column indices p + 1
r = a(sub2ind(size(a), 1:nDigits, p + 1)); % Radius values
% Get unique distances and map to colormap
[x, y] = pol2cart(r, 1);
distances = hypot(diff(x), diff(y));
[~, ~, d] = uniquetol(distances);
c = hsv(19); % Colormap
% Determine the number of lines to plot for the current frame
if f <= 48
nLines = max(round(f / 48 * nDigits), 1); % Increase from 1 to nDigits
else
nLines = max(round((96 - f) / 48 * nDigits), 1); % Decrease back to 1
end
% Create figure and polar axes
figure('Color', 'k', 'Visible', 'on');
pax = polaraxes('Color', 'k');
hold(pax, 'on');
% Plot lines with assigned colors
for i = 2:nLines
polarplot(pax, r(i - 1:i), [1, 1], 'Color', [c(d(i - 1), :), 0.1]);
end
% Configure plot
rlim([0, 1]);
axis(pax, 'off');
hold(pax, 'off');
end
Movie
Audio
This submission does not have audio.
