


- /
-
the winnner
on 19 Oct 2024
- 36
- 600
- 1
- 5
- 1345
Cite your audio source here (if applicable):
drawframe(1);
Write your drawframe function below
% Amardeep Kumar
% INDIA
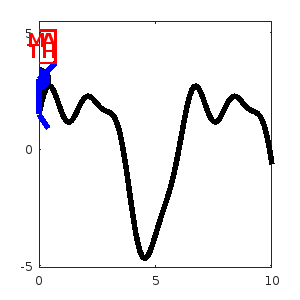
function drawframe(f)
% Parameters for the mountain and character movement
t = linspace(0, 10, 100); % X-axis for mountain (time)
mountain = 3 * sin(t) + 1.5 * cos(2*t) + 0.5 * sin(4*t); % Uneven mountain shape
char_pos_x = t(f); % X-position of character (moves over time)
char_pos_y = mountain(f); % Y-position of character (follows mountain)
% Plot the mountain path
plot(t, mountain, 'k-', 'LineWidth', 4); % Mountain in black
hold on;
% Scaling for larger character size
head_radius = 0.5; % Radius for the head (larger)
body_height = 1.5; % Height of the body (larger)
% Character's head (larger circle)
theta = linspace(0, 2*pi, 100);
x_head = char_pos_x + head_radius * cos(theta); % X-coordinates for head
y_head = char_pos_y + 1.5 + head_radius * sin(theta); % Y-coordinates for head
fill(x_head, y_head, 'b'); % Fill the head with blue color
% Character's body (line)
plot([char_pos_x, char_pos_x], [char_pos_y, char_pos_y + body_height], 'b', 'LineWidth', 4); % Body
% Character's legs (two lines)
plot([char_pos_x, char_pos_x - 0.4], [char_pos_y, char_pos_y - 0.6], 'b', 'LineWidth', 4); % Left leg
plot([char_pos_x, char_pos_x + 0.4], [char_pos_y, char_pos_y - 0.6], 'b', 'LineWidth', 4); % Right leg
% Character's arms (carrying the matrix)
plot([char_pos_x, char_pos_x - 0.7], [char_pos_y + 1.5, char_pos_y + 2.2], 'b', 'LineWidth', 4); % Left arm
plot([char_pos_x, char_pos_x + 0.7], [char_pos_y + 1.5, char_pos_y + 2.2], 'b', 'LineWidth', 4); % Right arm
% Matrix symbol above the head (2x2 matrix with 'M A T H')
rectangle('Position', [char_pos_x - 0.7, char_pos_y + 2.2, 1.4, 1.4], 'EdgeColor', 'r', 'LineWidth', 2); % Box around the matrix
text(char_pos_x - 0.5, char_pos_y + 3.2, 'M', 'FontSize', 14, 'FontWeight', 'bold', 'Color', 'r'); % 'M' in top-left
text(char_pos_x + 0.1, char_pos_y + 3.2, 'A', 'FontSize', 14, 'FontWeight', 'bold', 'Color', 'r'); % 'A' in top-right
text(char_pos_x - 0.5, char_pos_y + 2.7, 'T', 'FontSize', 14, 'FontWeight', 'bold', 'Color', 'r'); % 'T' in bottom-left
text(char_pos_x + 0.1, char_pos_y + 2.7, 'H', 'FontSize', 14, 'FontWeight', 'bold', 'Color', 'r'); % 'H' in bottom-right
% Formatting the plot
axis([0 10 -4 6]); % Adjust axis limits for bigger character and uneven path
axis equal;
hold off;
drawnow; % Force MATLAB to update the figure in real-time
end

