搜索
i am just thinking to make a project on software defined ratio SDR using matlab and its toolboxes but I am UG student in ECE don't know how to start can we have discussion here and want the guidance from the best or good persons in the field of wireless communication
Hello, Community Members!
Every day, we witness the incredible exchange of knowledge as over 100,000 users visit our community for answers or to get some code. We have such a vibrant community because of the dedicated group of contributors who volunteer their time and expertise to help one another.
We learned that many community users are looking for different ways to show their appreciation to contributors. In response, we're thrilled to announce the launch of our latest feature – Skill Endorsements.
When you visit a contributor's profile page, you'll notice a brand-new 'Endorsements' tab. Here, you have the power to acknowledge the skills of your fellow members by either endorsing a new skill or bolstering existing ones.
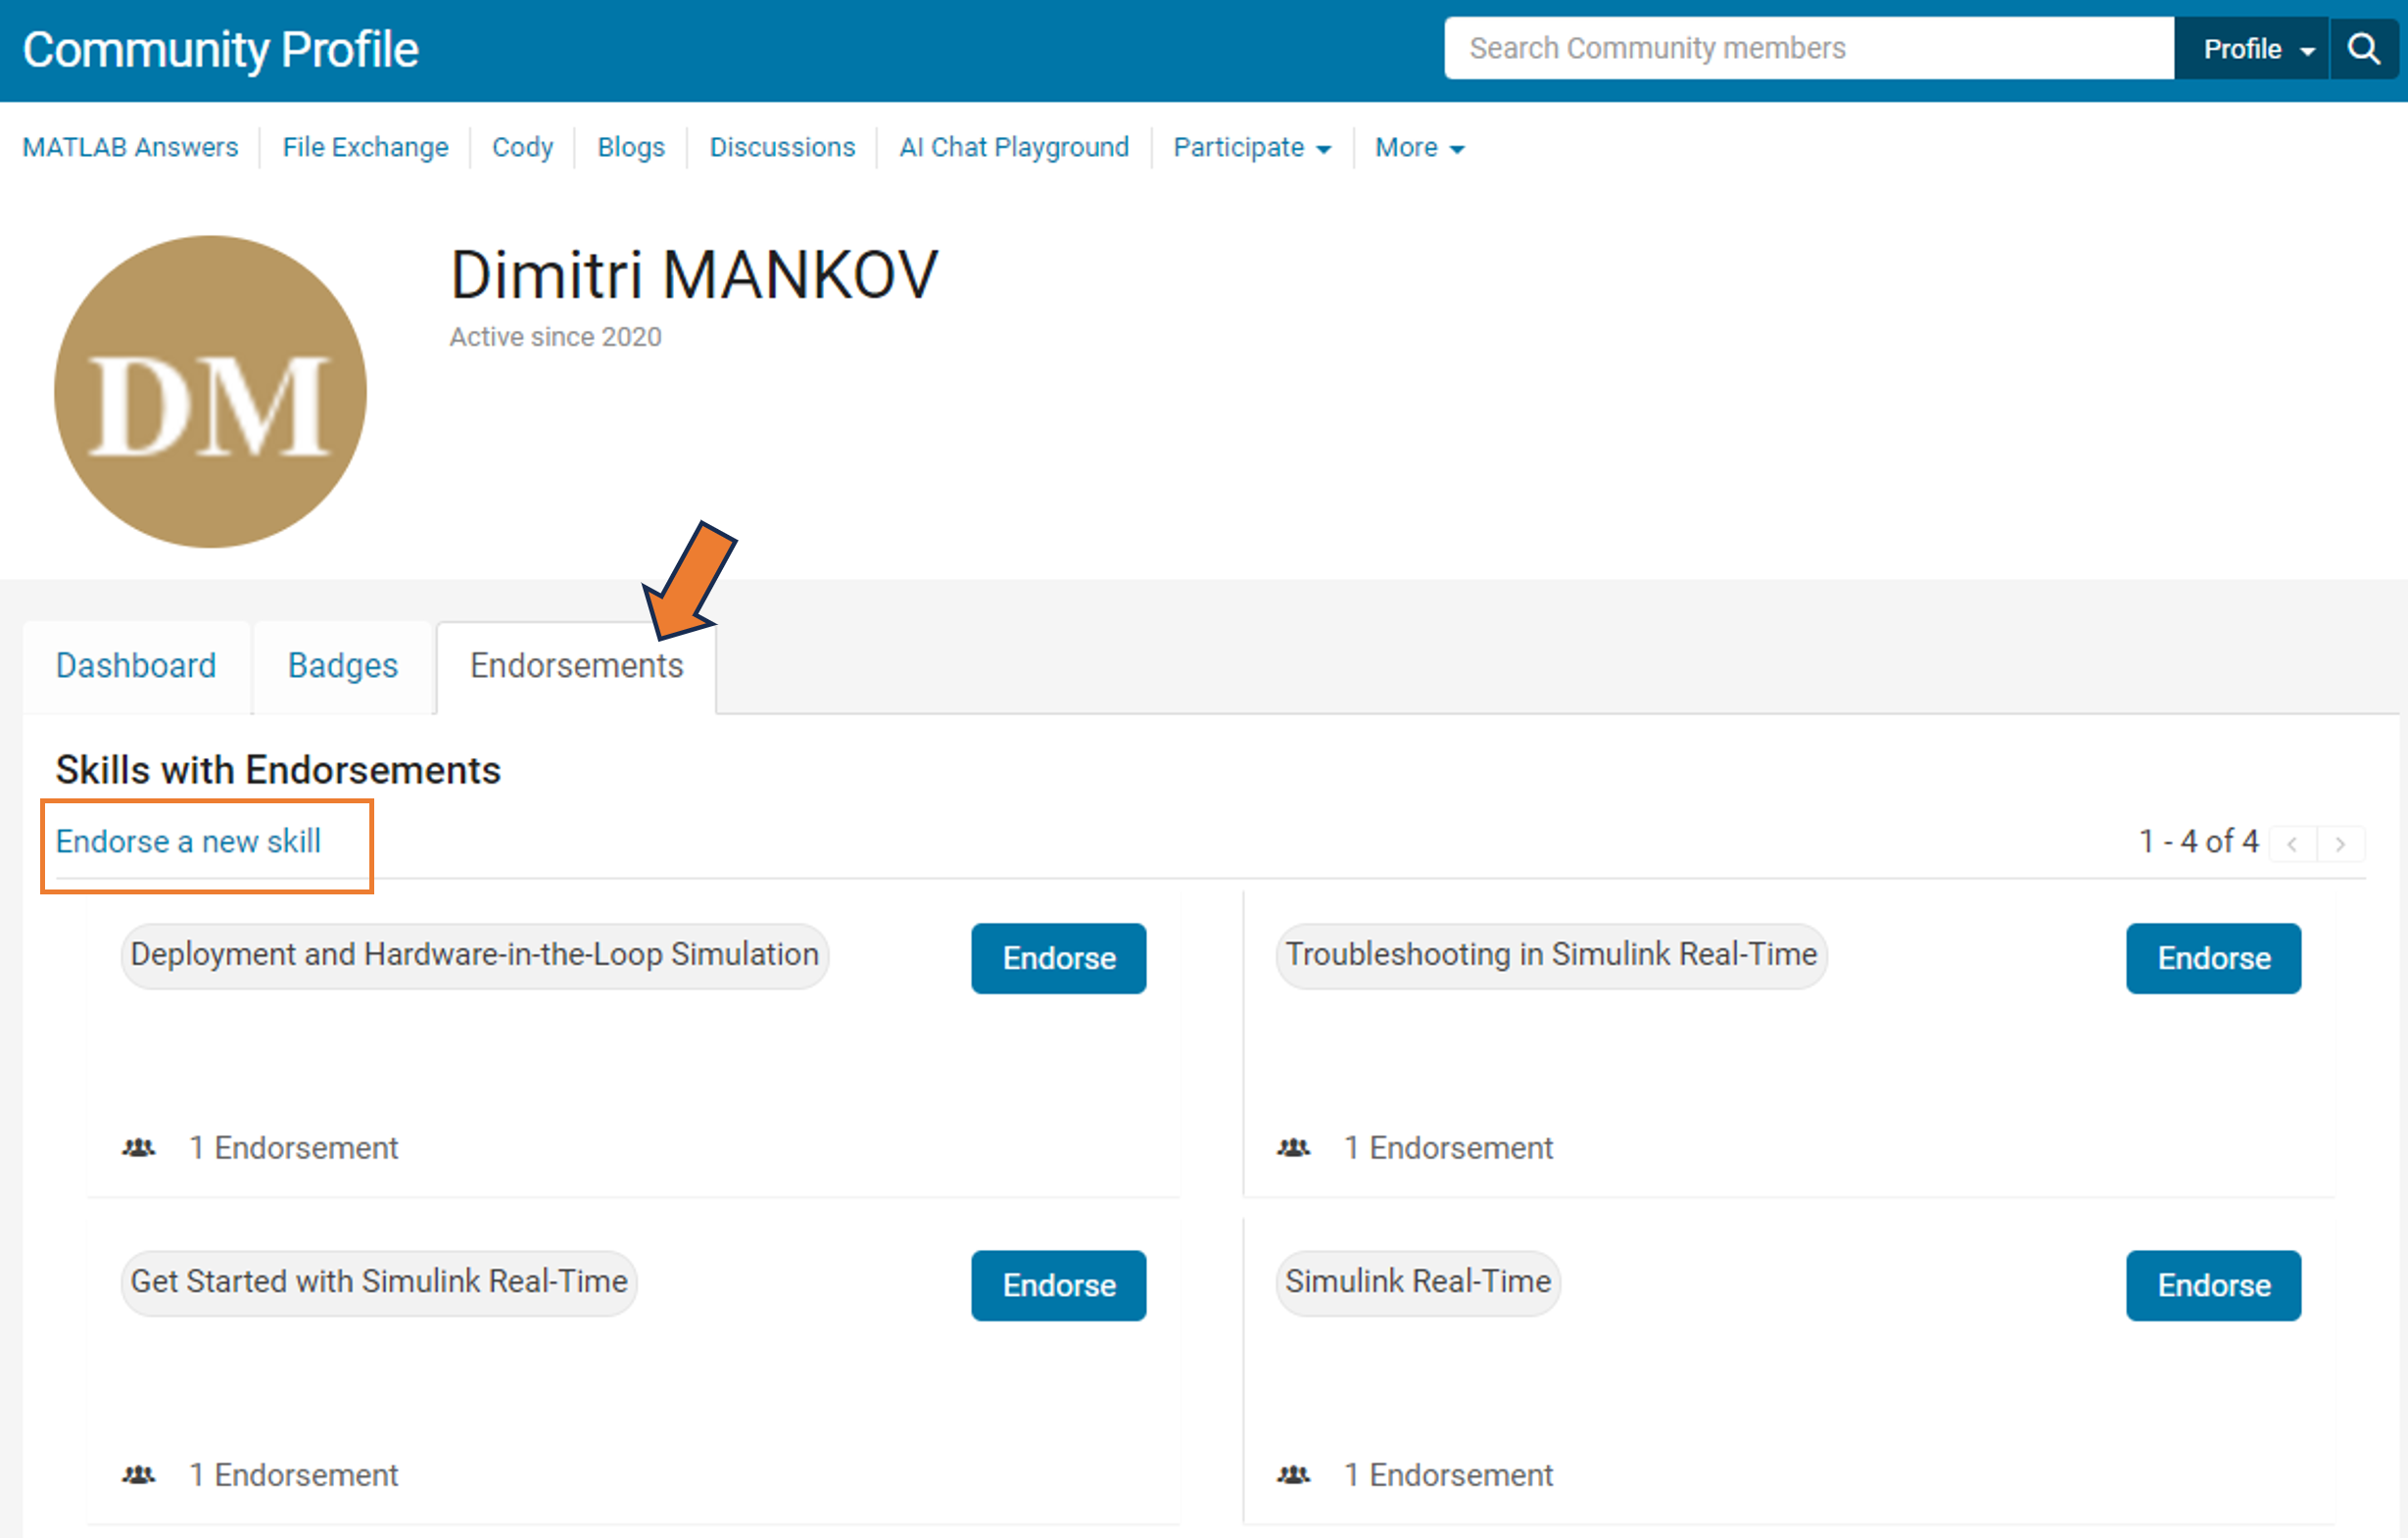
But it's more than just saying "thank you." By highlighting the strengths of our members, you're contributing to an environment of trust and making it easier for users to connect with experts in specific areas.
So, take a moment to reflect: Who has made a difference in your community experience? Whose expertise has guided you through a challenge? Show your appreciation and support their contributions – start endorsing skills today!
Your participation makes all the difference.
Warm regards,
MATLAB Central Community Team
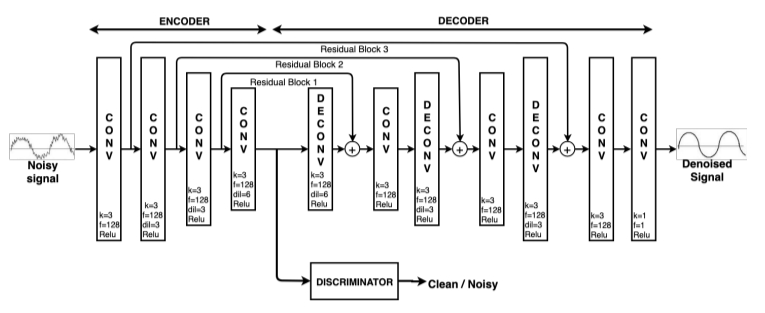
I am a beginner of deep learning, and meet with some problems in learning the MATLAB example "Denoise Signals with Adversarial Learning Denoiser Model", hope very much to get help!
1. visualizaition of the features
It is my understanding that the encoded representation of the autoencoder is the features of the original signal. However in this example, the output dimension of the encoder is 64xSignalLength. Does it mean that every sample point of the signal has 64 features?
2. usage of the residual blocks
The encoder-decoder model uses residual blocks (which contribute to reconstructing the denoised signal from the latent space, ). However, only the encoder output is connected to the discriminator. Doesn't it cause the prolem that most features will be learned by the residual blocks, and only a few features that could confuse the discriminator will be learned by the encoder and sent to the discriminator?
Hello everyone,
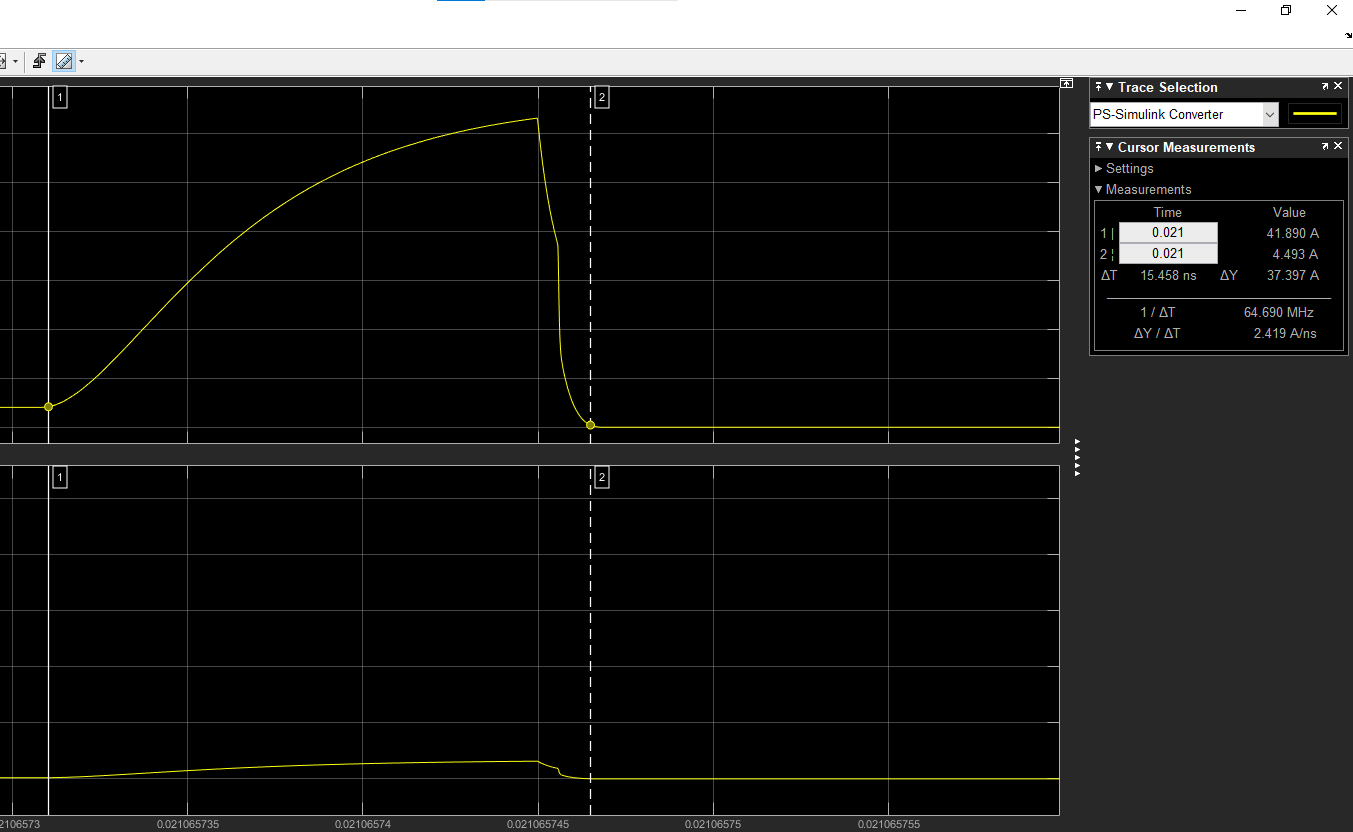
Im trying to simulate an 3-phase inverter, and for analysis of semicondcutor switches cuurent and voltage, I witness some unusal behaviour. I have connected a current sensor to the drain to calculate and visialize drain current, but the waveform is lookibg something like in picture if instaneous overshooting when going form high to low or vice versa, and the magnitude of the overshooting pulse can reach upto 500 Amps.
Kindly, guide me what am i doing here wrong? and one more thing is that I have set the Ids current to be 63Amps for N-channel Mosfet, but the output is 42-44 Amp max, what could be the reason behind it?
Thank you in advance!!
I would tell myself to understand vectorization. MATLAB is designed for operating on whole arrays and matrices at once. This is often more efficient than using loops.
Is there a reason for TMW not to invest in 3D polyshapes? Is the mathematical complexity of having all the same operations in 3D (union, intersection, subtract,...) prohibitive?
I cannot get any of my charts to be interactive using matlab. I need to be able to zoom into a chart and I cannot get any interactivity. In its purest from shouldnt this allow me to zoom into a chart?
plot(time, data);
% Enable zooming
zoom on;
(free account)
Ich habe das Problem das ich immer nur 1 Tag aufzeichnen kann (siehe Anhang), obwohl ich den Parameter au 15 tage gestellt habe.
Dear Community,
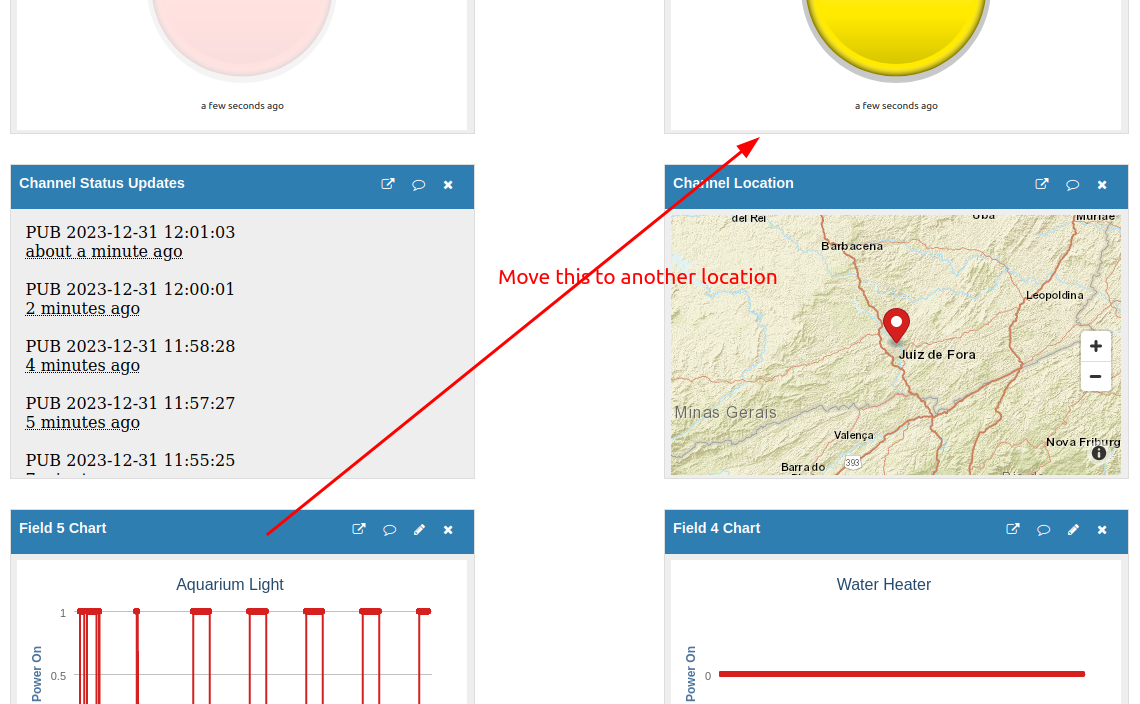
Since few weeks it looks like I have lost the ability to move cards order in the channel view. I used to be able to to so.
I tried with different browser and even on mobile and it does not work anymore. Did missed something ? Is this feature been removed ?
Thanks.
Tengo semanas trabajando con la app y al subir informacion me aparece que la ultima entrada fue hace menos de un minuto pero las gráficas no se actualizan, ya intente abrir la app desde diferentes navegadores,y dispositivos, en modo incognito, desabilitar extenciones y no obtengo resultados.
I am trying t set up a cellular Particle Boron and Sensor to track my well water levels but the data is not showing up in Thingspeak. I have activated and flashed code to the device, created a Particle account, a Thingspeak account (and channel), and a Webhook. Things mostly work as they should and I can even see the data from the sensor in my Particle Console "Events", but nothing seems to arrive in the Thingspeak Channel. I am looking for technical advice.
Graham
Hello,
it's been a couple weeks that the webrowser client seems to have issues for me.
I can't move the chart with my mouse anymore. And the Average option doesn't do anything, it is always displaying all the datapoints.
Same with the type of points, it is stuck on line type whatever I ask.
Also it will not update the page automatically when new points are uploaded, I have to hit F5 to refresh myself.
I can still control the number of days displayed though.
I tried on brave, firefox and edge and it all behaves the same.
Edit : I see that there are already multiple threads referencing some of those issues already. So the moderator can delete the thread if he feels like it is unecessary.
I have been developing a neural net to extract a set of generative parameters from an image of a 2-D NMR spectrum. I use a pair of convolution layers each followed by a fullyconnected layer; the pair are joined by an addtion layer and that fed to a regression layer. This trains fine, but answers are sub-optimal. I woudl like to add a fully connected layer between the addtion layer and regression, but training using default training scripts simply won't converge. Any suggestions? Maybe I can start with the pre-trained weights for the convolution layers, but I don't know how to do this.
JHP
I get the following error message when using a DELETE command.
I am using the correct api_key and channel ID Error Response: { "status": "401", "error": { "error_code": "error_auth_required", "message": "Authorization Required", "details": "Please provide proper authentication details." } }
I just cannot find out what I'm doing wrong. I've used Postman and Curl apps.
Can anyone help?
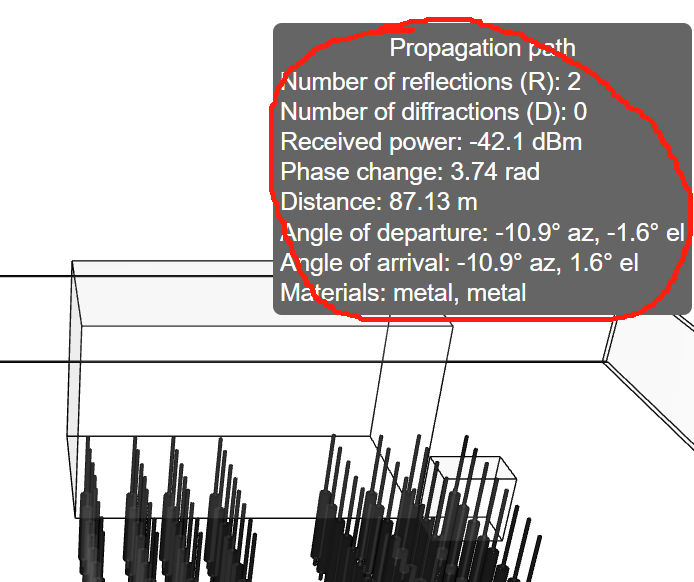
how can I do to get those informations?
Ich erinnere mich, dass die Visualisierungsfenster verschoben werden konnten. Das geht nicht mehr? Wer kennt den Trick?
I can't or it's not working anymore to change the position of the widgets on the channel panel.
I tested on Chrome and Firefox.
Expected:
I noticed a couple new replies show up on the recent poll a day or so ago, but since then, the page can't be loaded anymore in any browser I've tried.

Is MathWorks going to spend 5 years starting in 2024 making Python the #1 supported language?
I'm not sure it's authentic information, and am looking forward to a high level of integration with python.
Reference:
This is not a question, it is my attempt at complying with the request for thumbs up/down voting. I vote thumbs up, for having AI.....
I am not sure if specific AI errors are to be reported. Other messages I just read from others here and the AI Chat itself clearly state that errors abound.
My AI request was: "Plot 300 points of field 2"
AI Chat gave me, in part:
data = thingSpeakRead(channelID, 'Fields', 2, 'NumPoints', 300, 'ReadKey', readAPIKey);
% Extract the field values
field1Values = data.Field1;
% Plot the data
plot(field1Values);
The AI code failed due to "Dot indexing is not supported for variables of this type"
So, I corrected the code thus to get the correct plot:
data = thingSpeakRead(channelID, 'Fields', 2, 'NumPoints', 300, 'ReadKey', readAPIKey);
% Extract the field values
%field1Values = data.Field1;
% Plot the data
plot(data);
I see great promise in AI Chat.
Opie