搜索
Hello,
I am setting up a home energy monitoring system, all started from a blank sheet in arduino and its really working very well.
I would like to send data to thinkspeak which is not time dependant, i.e. send the X and Y values and format as a bar graph. The reason is, i have 12 channels monitoring energy (Wh) and i have this in an array which i plot on a local LCD and throughout the day the bars grow in height as the usage attributed to that channel grows. How can i do something similar in thing speak which by default applies a time stamp to received data.
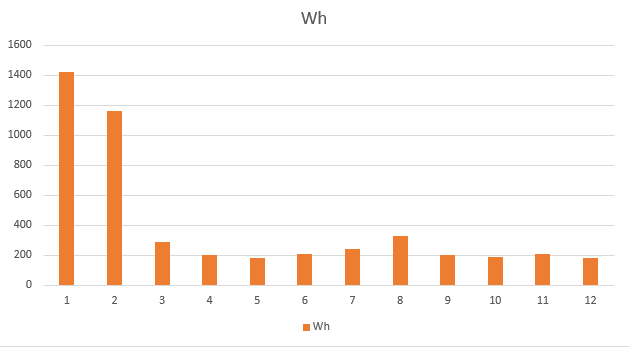
Very simply, each channel has an ID (0-11) and a number associated with the accumulative Wh. I have a similar thing in excel for development where my serial port data is saved to a csv which excell imports every minute and updates a bar graph a bit like this;
Ive had a good look (perhaps not good enough!) and i just cant see how this may be acheived with thingspeak without a clumbersome combination of 2 channels (given each channel has 8 fields) and then using a matlab visualisation to pull it all together. Perhaps its not has hard / messy as it sounds? I am paid user so can create extra channels if required.
Thanks,
Stuart