搜索
Hi, I just buy a Pico W board that can be easy programming in Thonny IDE using Micropython library. But I find difficult to use thingspeak without compatible library and some examples. Please take this Raspberry board in consideration, it is cheap and it is more reliable. Thank you!
Hello,
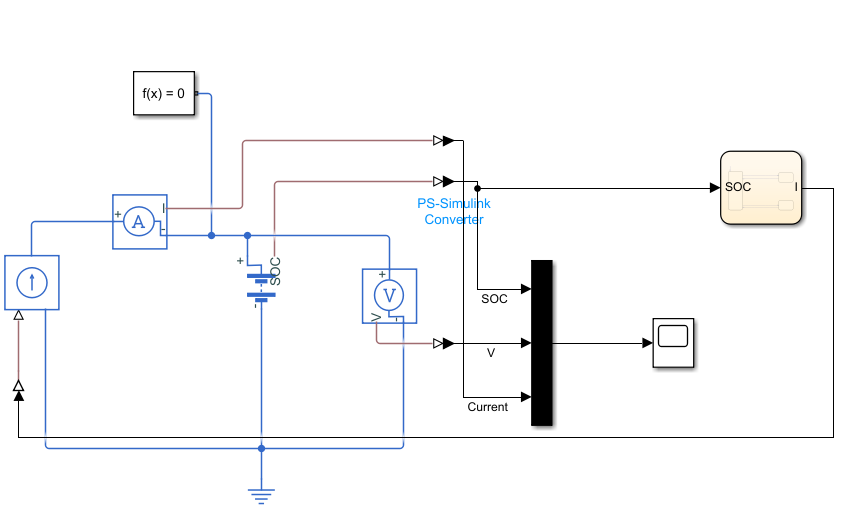
I am designing a battery model and its control to undergo cyclic charge and discharge.
The battery model is created by using a simscape electrical battery block (Table-based).
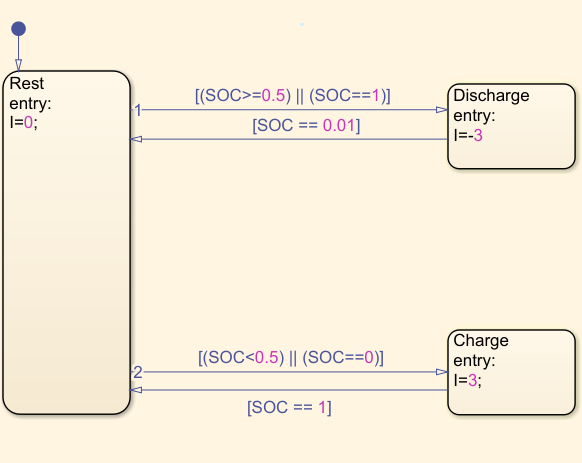
The control is modeled using Stateflow. The statflow chart takes SOC values as inputs and provide current values as outputs. By default, the battery will be at rest and no current is drawn at that state (I=0A). And then based on the SOC % of the battery, it goes to charge (3A current) or discharge (-3A current) state. I have defined the controls as follows.
- If the battery has SOC >= 50%, it has to discharge. If the battery has SOC < 50%, it has to charge.
- While discharging, if the battery reaches 0% SOC, it goes to rest.
- While charging, if the battery reaches 100% SOC, it goes to rest.
I have defined initial SOC as 50%.
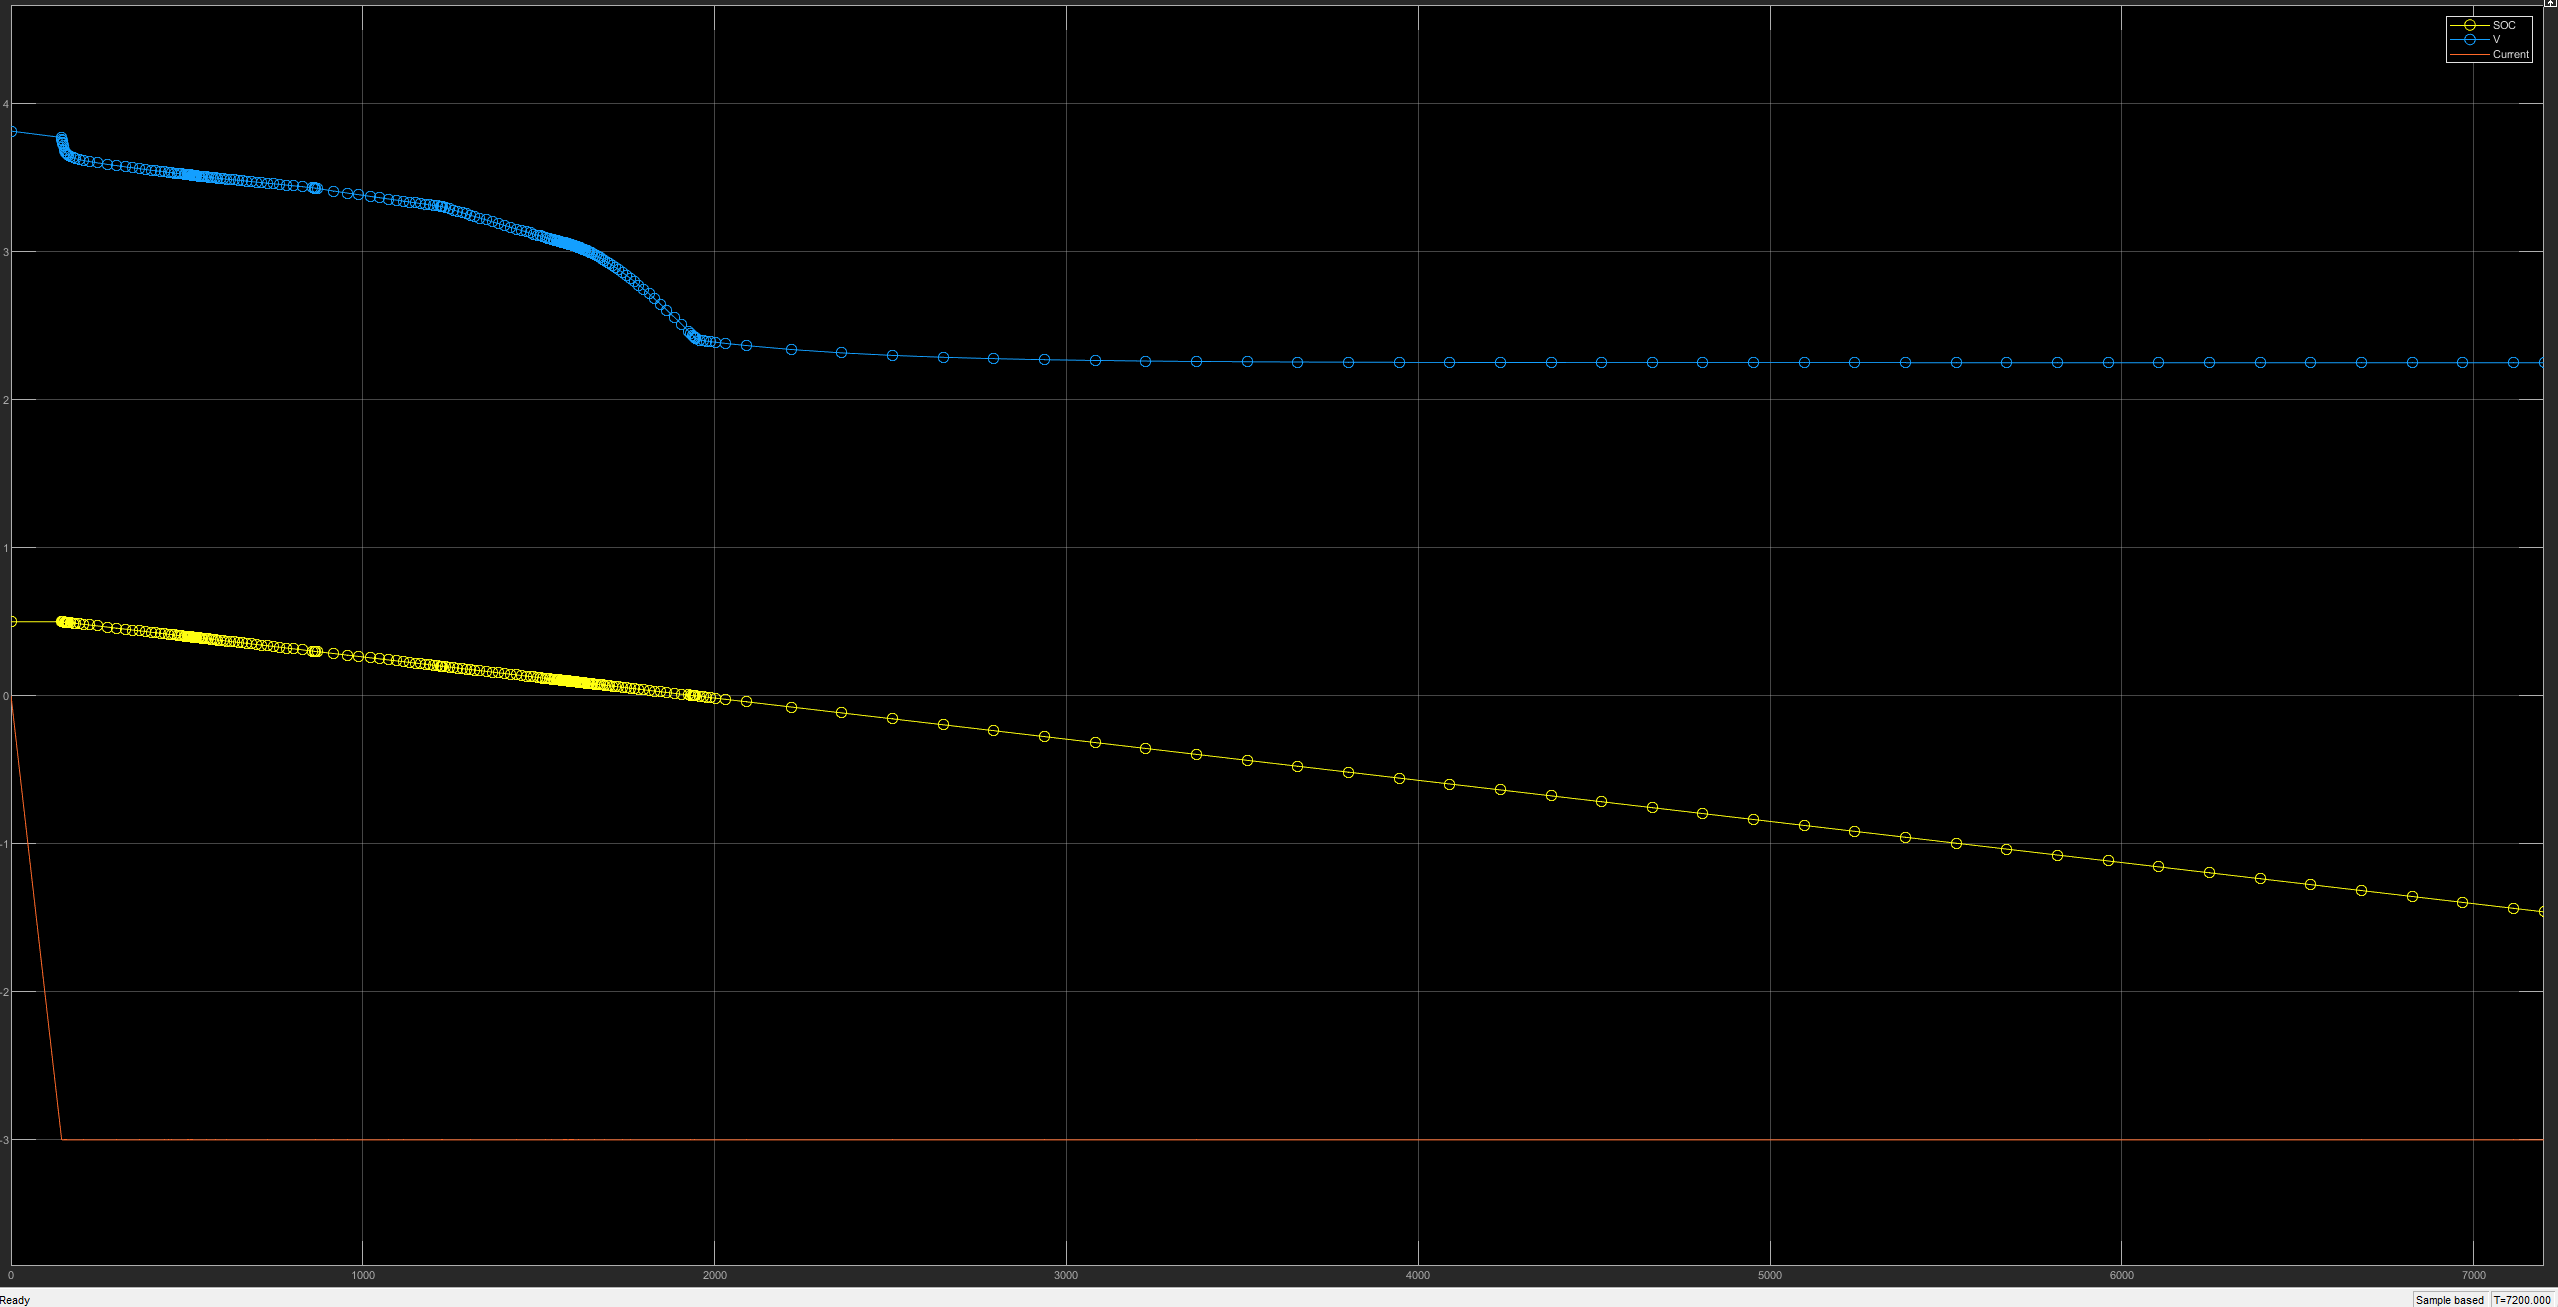
When I run the simulation, the battery started to discharge as per the condition provided in the stateflow chart.
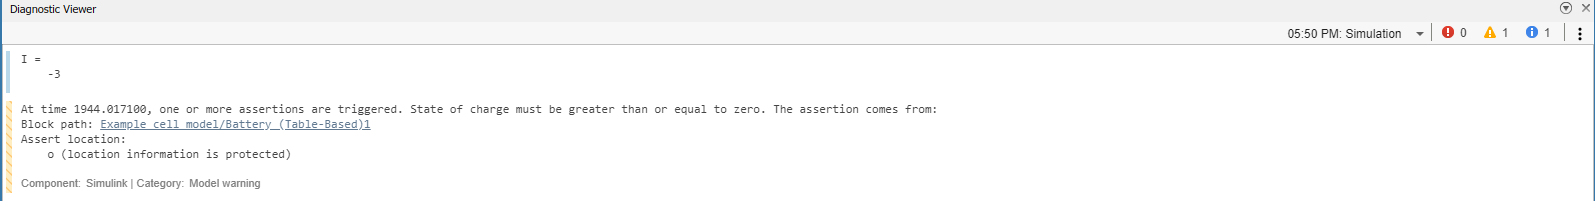
I = -3
But the battery has not come to rest state after reaching 0% S0C.
I am getting a warning that,
At time 1944.017100, one or more assertions are triggered. State of charge must be greater than or equal to zero. The assertion comes from: Block path: Example_cell_model/Battery (Table-Based)1Assert location: o (location information is protected)
I don't understand why the battery has not came back to rest state.
Do anyone has any idea for the cause of this problem and how to resolve it?
Thanks in advance.
Hi everyone. Any possibility in using MQTT with Talkback. I would like to subscribe to the Talkback with MQTT on the ESP8266 and then send data based on the Talkback. Subscribing to MQTT would make it easier as to poll it via REST Http.Thanks
The ThingSpeak certificate was updated recently. If you are using secure communication for your devices, you may need to update the certificate or certificate fingerprint on your devices.
Hi everyone,
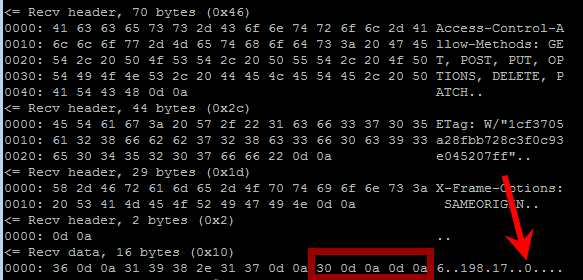
This is the second time in few years ThingHTTP changes the way it returns data; any way to roll that back or control it? Back in 2020 it statted padding the GET request with CRs and LFs (last time I forgot what changed but it was similar - just padding the GET return with characters).
Now it's adding "0" zero after the GET payload and then 2 CRs and LFs at the end after that zero;
Is there any way to control how ThingHTTP returns the payload back? It's messing up my parsing firmware :)
Hi,
I have been using ThingSpeak upload on several CO2 detectors based on ESP32 Arduino board, for six mounth.
Some are using direct API HTTPS requests to write values on ThingSpeak channels. Those are still working (through a proxy)
Others with similar programmetion but using ThingSpeak secure Communication Library for Arduino, have stopped uploading values since 19/07/2022 around 16h.
Was there any non publiched modification on the library at this time ?
Did any body notice something similar ?
I have not investigateg the error yet...
Thanks for feed back,
TC
Hello,
In the previous versions, we were able to change the reaction line properties to Reactant, Product, or Reactant and Product. This option is not available in 2021b. How do we change the proerpties if we reaction line is both Reactant and Product?
Thanks
Hi Everyone,
I'm a novice when it comes to programming and i'm trying to figure out why my weather data is not loading into my channel. I've had the code working previously before thingspeak went from MQTT to MQTT3. I'm having issues around the publish.single().
import subprocess
import paho.mqtt.publish as publish
import psutil
import string
import json
from statistics import median
from pms5003 import PMS5003
#weather_iot
import requests
import time
from datetime import datetime
from csv import writer
import math
import paho.mqtt.publish as publish
#Thingspeak channel and MQQT protocol
mqtt_client_ID = "detail removed"
mqtt_username = "detail removed"
mqtt_password = "detail removed"
channelID = "detail removed"
apiKey = "detail removed"
topic = "channels/" + channelID + "/publish/"
mqttHost = "mqtt3.thingspeak.com"
tTransport = "websockets"
useSSLWebsockets = False
tTLS = None
tPort = 80
def csv():
List=[now, Temperature1, IAQ1, Pressure1, Humidity1, PM1_0, PM2_5, PM10]
with open('Weather.csv', 'a') as f_object:
writer_object = writer(f_object)
writer_object.writerow(List)
f_object.close()
return
#PM sensor configuration
pms5003 = PMS5003(
device='/dev/ttyAMA0',
baudrate=9600,
pin_enable=22,
pin_reset=27
)
#Open C File
proc = subprocess.Popen(['./bsec_bme680'], stdout=subprocess.PIPE)
listIAQ_Accuracy = [ ]
listPressure = [ ]
listGas = [ ]
listTemperature = [ ]
listIAQ = [ ]
listHumidity = [ ]
listStatus = [ ]
for line in iter(proc.stdout.readline, ''):
lineJSON = json.loads(line.decode("utf-8")) # process line-by-line
lineDict = dict(lineJSON)
listIAQ_Accuracy.append(int(lineDict['IAQ_Accuracy']))
listPressure.append(float(lineDict['Pressure']))
listGas.append(int(lineDict['Gas']))
listTemperature.append(float(lineDict['Temperature']))
listIAQ.append(float(lineDict['IAQ']))
listHumidity.append(float(lineDict['Humidity']))
listStatus.append(int(lineDict['Status']))
if len(listIAQ_Accuracy) == 20:
#generate the median for each value
IAQ_Accuracy = median(listIAQ_Accuracy)
Pressure = median(listPressure)
Gas = median(listGas)
Temperature = median(listTemperature)
IAQ = median(listIAQ)
Humidity = median(listHumidity)
Status = median(listStatus)
#clear lists
listIAQ_Accuracy.clear()
listPressure.clear()
listGas.clear()
listTemperature.clear()
listIAQ.clear()
listHumidity.clear()
listStatus.clear()
#Temperature Offset
Temperature = Temperature + 2
IAQ1 = round(IAQ,1)
Temperature1 = round(Temperature, 1)
Humidity1 = round(Humidity, 1)
Pressure1 = round(Pressure, 1)
data = pms5003.read()
if Humidity1 < 80:
CF = 1
else:
CF = (Humidity1/100)*1.3
PM1_0 = format(data.pm_ug_per_m3(1.0))
PM2_5 = format(data.pm_ug_per_m3(2.5))
PM10 = format(data.pm_ug_per_m3(10))
PM1_0 = round(int(PM1_0) / CF,)
PM2_5 = round((int(PM2_5)/CF/25) * 100,)
PM10 = round((int(PM10)/CF/50) * 100,)
now = datetime.now()
tPayload = "field1=" + str(Temperature1)+ "&field2=" + str(IAQ1)+ "&field3=" + str(Pressure1)+ "&field4=" + str(Humidity1)+ "&field5=" + str(PM1_0)+ "&field6=" + str(PM2_5)+ "&field7=" + str(PM10)
try:
print ("[INFO] Data prepared to be uploaded")
publish.single(topic, payload=tPayload, hostname=mqttHost, transport=tTransport, port=tPort, tls=tTLS, client_id=mqtt_client_ID, auth={'username':mqtt_username,'password':mqtt_password})
print ("[INFO] Data sent for 7 fields: ", Temperature1, IAQ1, Pressure1, Humidity1, PM1_0, PM2_5, PM10)
except (KeyboardInterrupt):
break
except:
print ("[INFO] Failure in sending data")
csv()
clear
clc
%----------Deklarasi Data Aktual atau Data Mentah (x^(0))----------
%----------Berdasarkan Urutan Periode Waktunya----------
X_1 = [85983, 70017, 42320, 26565, 21439, 113409, 271185, 35930, 7182, 3775, 2407, 1350, 48058, 261484, 62897, 9998, 2982];
X_2 = [408, 454, 941, 17162, 35687, 19932, 61510, 81608, 122599, 199153, 156101, 120015, 473173, 528996, 296969, 191202, 185226];
X_3 = [124171, 190032, 219189, 152435, 130347, 191144, 133795, 53560, 31457, 26162, 15893, 20052, 19478, 48404, 9502, 3737, 2332];
X_4 = [70409, 207282, 1494766, 1433620, 1110495, 2224241, 2359721, 2913705, 2800503, 912552, 600338, 297624, 232018, 94727, 1963767, 957424, 189150];
X_5 = [204975, 190683, 122735, 60850, 46974, 33007, 65187, 79223, 53214, 48594, 26030, 29108, 38010, 54320, 32069, 24323, 27081];
X_6 = [67018, 38201, 19335, 11657, 12855, 6542, 6611, 4101, 2953, 2723, 1313, 1393, 1866, 2354, 2157, 1740, 1231];
X_7 = [190988, 182134, 120311, 60621, 44094, 31392, 53312, 71792, 50007, 44888, 24092, 27284, 36540, 52766, 30289, 23357, 26715];
X_8 = [72365, 46900, 21759, 11886, 15735, 8157, 18336, 11826, 6160, 5761, 3251, 3537, 4068, 3788, 3937, 2706, 1797];
n = length(X_1); % panjang data
%----------Plotting Data Awal Covid-19----------
figure('Name','Data Awal');
sbx = 1:n;
plot(sbx,X_1,'k-o');
%hold on
%plot(sbx, X_2, '-*', sbx, X_3, '-*', sbx, X_4, '-*', sbx, X_5, '-*', sbx, X_6, '-*', sbx, X_7, '-*', sbx, X_8, '-*')
%hold off
title('Data Awal Penjangkitan Covid-19 ');
%legend('Kasus Positif', 'Pelaku Perjalanan', 'Pelaku Kontak Erat', 'Realisasi Vaksinasi Keseluruhan', 'Perilaku Memakai Masker', 'Perilaku TIDAK Memakai Masker', 'Perilaku Menjaga Jarak dan Menghindari Kerumunan', 'Perilaku TIDAK Menjaga Jarak dan Menghindari Kerumunan');
ylabel('Jumlah (Data)');
xlabel('Periode Waktu (k)');
grid on;
grid minor;
%----------Nilai Akumulasi AGO----------
Ago_1 = cumsum(X_1);
Ago_2 = cumsum(X_2);
Ago_3 = cumsum(X_3);
Ago_4 = cumsum(X_4);
Ago_5 = cumsum(X_5);
Ago_6 = cumsum(X_6);
Ago_7 = cumsum(X_7);
Ago_8 = cumsum(X_8);
%----------Nilai Pembangkit Rata-rata dari Dua Data yang Berdekatan----------
for k = 2:n
Z(k) = 0.5*(Ago_1(k) + Ago_1(k-1)); %Z(k) generates a sequence for the immediate mean of xi(1)
end
%----------Mencari Nilai Parameter a dan b----------
% 1) The constant (-a) is known as the system's development coefficient
% 2) b(i)x(i)(k) the driving term
% 3) b(i) the driving coefficient
% 4) a=[a,b(i),b(2)] the sequence of parameters.
syms a b;
c = [a,b]';% Constitutes a matrix
Yn_1 = X_1; %Yn is a constant term vector
Yn_1(1)= [];
Z(1) = [];
Ago_2(1) = [];Ago_3(1) = [];Ago_4(1) = [];Ago_5(1) = [];Ago_6(1) = [];Ago_7(1) = [];Ago_8(1) = [];
B = [-Z;Ago_2;Ago_3;Ago_4;Ago_5;Ago_6;Ago_7;Ago_8]';
c = inv(B'*B)*(B'.*Yn_1);
c = c';
a = c(:,1);% parameter a
b2 = c(2); %parameter b
b3 = c(3);
b4 = c(4);
b5 = c(5);
b6 = c(6);
b7 = c(7);
b8 = c(8);
jml_b2Ago2 = b2*Ago_2;
jml_b3Ago3 = b3*Ago_3;
jml_b4Ago4 = b4*Ago_4;
jml_b5Ago5 = b5*Ago_5;
jml_b6Ago6 = b6*Ago_6;
jml_b7Ago7 = b7*Ago_7;
jml_b8Ago8 = b8*Ago_8;
total_biAgoi = jml_b2Ago2 + jml_b3Ago3 + jml_b4Ago4 + jml_b5Ago5 + jml_b6Ago6 + jml_b7Ago7 + jml_b8Ago8;
%----------Proses Whitening----------
F = [];
F(1) = X_1(1);
for k = 1:n
%F(k+1) = exp(-a.*k)*(X_1(1)- k.*total_biAgoi(0) + integral(total_biAgoi(k))*exp^(a.*k));% Find the GM(1,1) model formula
end
Leave your MATLAB computer at home
35%
Bring computer but don't use MATLAB
18%
Bring computer and use MATLAB
11%
Bring phone and use MATLAB online
3%
Use MATLAB on someone else's comput
1%
Vacation? What's that?
32%
18554 个投票
Hi,
The template code provided for the visualisation of a '2D line plot with y axis on both left & right side' does not work with my public channel 1789024 and Field 1 and Field 2 data. The axes are drawn and automatically adjust to the number of points which are chosen and the range of data values. But no points are actually plotted ( visible ). I have a free license and two channels in total. Are there license restrictions or can anyone see why the code doesn't work ?
regards,
SpacerLabs
I need to model temperature rise of a resistor due to joule heating with a variable supply or a variable resistor. Is there a simulink component that can be used for this or it has to be implemented with the physical equations fed into block diagrams?
Can someone help give an idea of how this can be modeled?
How to implement IoT nodes based on processing power, memory size, power consumption, etc in Matlab.
please
provide such kind of implemenation in matlab code.
Join us on a upcoming live to learn about how the deep learning frameworks in MATLAB and Simulink can be used with TensorFlow and PyTorch to provide enhanced capabilities for building and training your Machine Learning model.
- Date: 7/14 at 11am
- Link: https://youtu.be/ViI01KNIMh4
Watch this preview to learn more. https://youtu.be/ZPQgcFPCFZM
Hi,
response
{"created_at":"2022-07-08T01:17:08Z","entry_id":16662856,"status":null}
it's normal, solution?
thanks
We are using thingspeak for collect data from sensor and we are using that data from thingspeak to website using thingspeak API but sensor real time data is missing in API, can you please help to resolve it. is it a Sensor issue or need to update anythings in thingspeak. https://api.thingspeak.com/channels.json?api_key=xxxxxxxxxxxxxxxx In this API we need to know mow much Garbage is empty we are using hc-sr04 ultrasonic sensor for it
Simple app created using Simulink support package for Android device. App created but data is not getting logged on thingspeak channel the error msg on app log is as attached.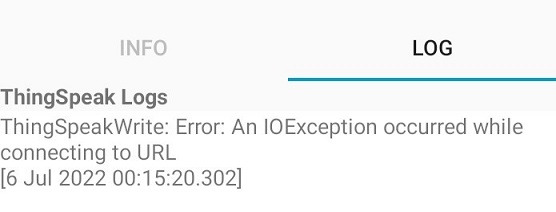
Hi,
I'm trying to connect my Sierra Wireless GL7600 4G modem with ThingSpeak.
To do so I send:
AT+KCNXCFG=1,"GPRS","TM" (APN)
AT+KHTTPSCFG=1,"api.thingspeak.com",443 (configure https session and connect)
When I try to send data
AT+KHTTPGET=1,"api.thingspeak.com/update?api_key=9**********J&field1=2"
I always get a NO CARRIER error.
I have installed the root certificate from thingspeak.com in the modem.
Do I need anything else?
Regards
Jan
Hi, the status of "Updated" on my channel page show the correct updated time but when we enter the single channel, the last entry did not show the latest update time, and the data did not uploaded for all my channel. Anyone facing this problem?
Hallo I have a problem delivery data to thingspeak. I using 2 sensor but, only 1 sensor delivered to thingspeak. information that appear "field value unavailable". how to problem solved? thank you.