MATLAB 帮助中心
Create legend labels for polar plot
createLabels(p,format,array)
createLabels(p,format,array) adds the specified format label to each array of the polar plot p. The labels are stored as a cell array in the LegendLabels property of p.
p
format
array
LegendLabels
example
collapse all
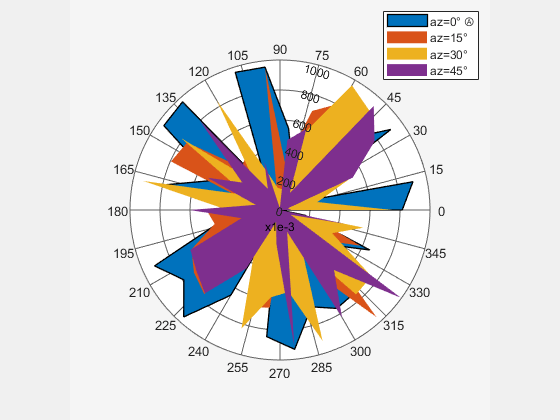
Create a polar plot of unique values. Generate a legend label for this plot.
p = polarpattern(rand(30,4),Style="filled"); createLabels(p,"az=%d#deg",0:15:45)
Polar plot, specified as a scalar handle.
Example: polarpattern
polarpattern
Format for legend label added to the polar plot, specified as a cell array. For more information on legend label format see, legend.
legend
Example: "az=%d#deg"
"az=%d#deg"
Data Types: string
string
Values to apply the format, specified as an array. The values can be an array of angles or array of magnitudes.
Example: [0 15 30 45]
[0 15 30 45]
Data Types: double
double
Introduced in R2016a
add | addCursor | animate | findLobes | replace | showPeaksTable | showSpan
add
addCursor
animate
findLobes
replace
showPeaksTable
showSpan
You clicked a link that corresponds to this MATLAB command:
Run the command by entering it in the MATLAB Command Window. Web browsers do not support MATLAB commands.
选择网站
选择网站以获取翻译的可用内容,以及查看当地活动和优惠。根据您的位置,我们建议您选择:。
您也可以从以下列表中选择网站:
如何获得最佳网站性能
选择中国网站(中文或英文)以获得最佳网站性能。其他 MathWorks 国家/地区网站并未针对您所在位置的访问进行优化。
美洲
欧洲
亚太
联系您当地的办事处