rfplot
Plot S-parameter data
Syntax
Description
rfplot( plots the magnitude in decibels versus
frequency of all S-parameters (S11,
S12 ... SNN) on
the current axes.s_obj)
rfplot(___, plots S-parameters
using the line parameters specified in LineSpec)LineSpec.
rfplot(___,plots S-parameters
according to the type specified in plotflag)plotflag.
rfplot( plots the magnitude
of Si
i reflection coefficients or the diagonal
elements of the S-parameter matrix s_obj,'diag')'diag' on the current axis.
hline = rfplot(___)hline.
[
plots the magnitude response of the S-parameters of the RF filter.hline,haxes] = rfplot(filter,frequencies)
Examples
Use the sparameters function to create a set S-parameters.
hs = sparameters('default.s2p');Plot all the S-parameters.
rfplot(hs)

Plot S21.
rfplot(hs,2,1)

Plot the angle of S21 in degrees.
rfplot(hs,2,1,'angle')
Plot the real part of S21.
rfplot(hs,2,1,'real')
Create an S-parameter object from a three-port Touchstone file.
sobj = sparameters('default.s3p');Plot S12, S13, S22, S23, S32, and S33.
rfplot(sobj,[1:3],[2:3],'abs')
Create an S-parameter object from a three-port Touchstone file.
sobj = sparameters('default.s3p');Plot S12, S33, S11, and S22.
rfplot(sobj,{[1 2]; [3 3]; [1 1]; [2 2]},'abs') 
Create an S-parameter object from a three-port Touchstone file.
sobj = sparameters('default.s3p');Plot the reflection coefficients of the S-parameters.
rfplot(sobj,'diag','abs')

Plot the transmission coefficients of the S-parameters.
rfplot(sobj,'triu',1,'abs')
hold on
rfplot(sobj,'tril',-1,'abs')

Input Arguments
S-parameters, specified as RF Toolbox™ network parameter object. To create this type of object, use
the sparameters function.
Row index of the data to plot, specified as a scalar, vector, or cell array.
| Type of Plot | How to Specify Indices |
|---|---|
| Single parameter | Specify
|
| Set of parameters | Specify
|
| Specific parameters | Specify a cell array of
|
Column index of the data to plot, specified as a scalar, vector, or cell array.
| Type of Plot | How to Specify Indices |
|---|---|
| Single parameter | Specify
|
| Set of parameters | Specify
|
| Specific parameters | Specify a cell array of
|
Line style, marker, and color, specified as a character vector or a string containing symbols. The symbols can appear in any order. You do not need to specify all three characteristics (line style, marker, and color). For example, if you omit the line style and specify the marker, then the plot shows only the marker and no line.
Example: '--or'creates a dashed line in red with
circular markers
| Line Style | Description | Resulting Line |
|---|---|---|
'-' | Solid line |
|
'--' | Dashed line |
|
':' | Dotted line |
|
'-.' | Dash-dotted line |
|
| Marker | Description | Resulting Marker |
|---|---|---|
'o' | Circle |
|
'+' | Plus sign |
|
'*' | Asterisk |
|
'.' | Point |
|
'x' | Cross |
|
'_' | Horizontal line |
|
'|' | Vertical line |
|
's' | Square |
|
'd' | Diamond |
|
'^' | Upward-pointing triangle |
|
'v' | Downward-pointing triangle |
|
'>' | Right-pointing triangle |
|
'<' | Left-pointing triangle |
|
'p' | Pentagram |
|
'h' | Hexagram |
|
| Color Name | Short Name | RGB Triplet | Appearance |
|---|---|---|---|
'red' | 'r' | [1 0 0] |
|
'green' | 'g' | [0 1 0] |
|
'blue' | 'b' | [0 0 1] |
|
'cyan'
| 'c' | [0 1 1] |
|
'magenta' | 'm' | [1 0 1] |
|
'yellow' | 'y' | [1 1 0] |
|
'black' | 'k' | [0 0 0] |
|
'white' | 'w' | [1 1 1] |
|
Plot types, specified as either 'db', 'real',
'imag', 'abs', or
'angle'.
Example: 'angle'
Frequencies to plot magnitude response, specified as a vector.
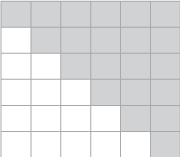
Portion of the S-parameters matrix, specified as 'triu'
or 'tril'. Specify triu to plot the
Upper Triangular (RF Toolbox) portion of
the matrix and tril to plot the Lower Triangular (RF Toolbox)
portion.
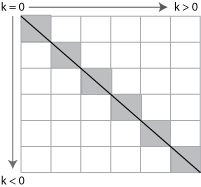
Diagonals to include, specified as a scalar.
k = 0specifies the main diagonal.k > 0specifies a diagonal above the main diagonal.k < 0specifies a diagonal below the main diagonal.
Output Arguments
More About
The upper triangular portion of a matrix includes the main diagonal and all elements above it. The shaded elements in this graphic depict the upper triangular portion of a 6-by-6 matrix.
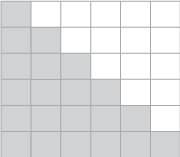
The lower triangular portion of a matrix includes the main diagonal and all elements below it. The shaded elements in this graphic depict the lower triangular portion of a 6-by-6 matrix.
Version History
Introduced before R2006aSee Also
sparameters | sparameters (RF Toolbox) | setrfplot (RF Toolbox)