Planning a 5G Fixed Wireless Access Link over Terrain
This example shows how to plan a fixed wireless access (FWA) link over terrain using 5G technologies. FWA is a use case for 5G to enable broadband service to homes or enterprises where wireline services are either unavailable or underperforming. FWA connects a base station to a user's fixed wireless terminal (FWT) [1]. At the high frequencies required for 5G, terrain and path loss impairments like foliage and weather play an important role in determining link success.
The example creates a base station and multiple receiver sites in a suburban environment, situating the antennas to achieve line-of-sight visibility over intermediate terrain. A multi-user multiple-input, multiple-output (MU-MIMO) system with high gain antennas is designed using Antenna Toolbox™ and Phased Array System Toolbox™. Signal strength at the receiver sites is assessed for two frequencies in the presence of path loss impairments.
Create Base Station Site in 28 GHz Band
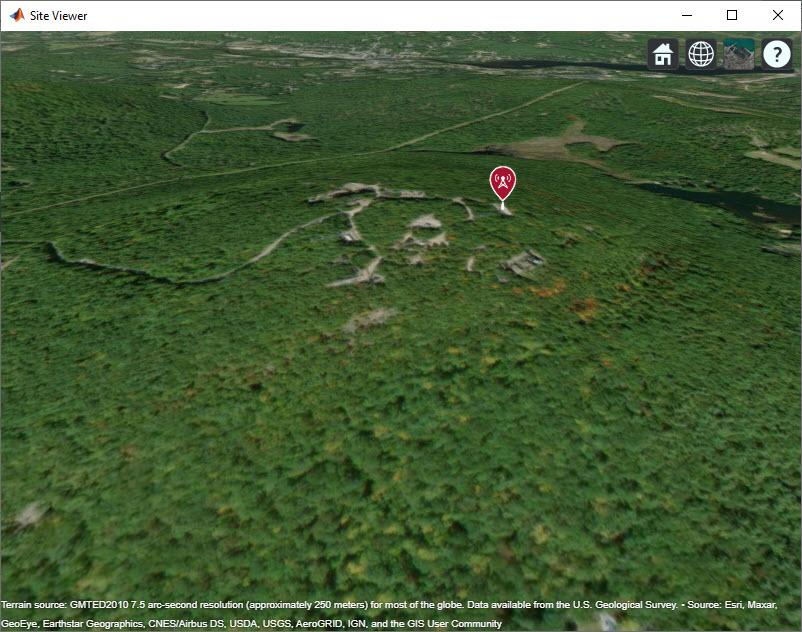
Create a transmitter site on South Uncanoonuc Mountain in Goffstown, New Hampshire, US. The mountain is home to several transmitting facilities that serve the area. Define the transmitter site to represent a base station transmitting at 28 GHz with 1 Watt of power. Show the site in Site Viewer and rotate the view to visualize the site with surrounding terrain.
fq = 28e9; % 28 GHz

tx = txsite("Name","South Uncanoonuc (BS)", ...
    "Latitude",42.983723, ...
    "Longitude",-71.587173, ...
    "TransmitterPower",1, ...
    "TransmitterFrequency",fq);
show(tx)
Create Receiver Sites
Create three receiver sites in the area and show the sites on the map. Each receiver site represents a site where a user's fixed wireless terminal is placed.
rxBedford = rxsite("Name","Bedford Town Center", ...
    "Latitude",42.946193, ...
    "Longitude",-71.516234);

rxStA = rxsite("Name","St. Anselm College", ...
    "Latitude",42.987386, ...
    "Longitude",-71.507475);

rxGPD = rxsite("Name","Goffstown Police Dept", ...
    "Latitude",43.009335, ...
    "Longitude",-71.539083);

rxs = [rxBedford, rxStA, rxGPD];
show(rxs)
Achieve Line-of-Sight Link Visibility
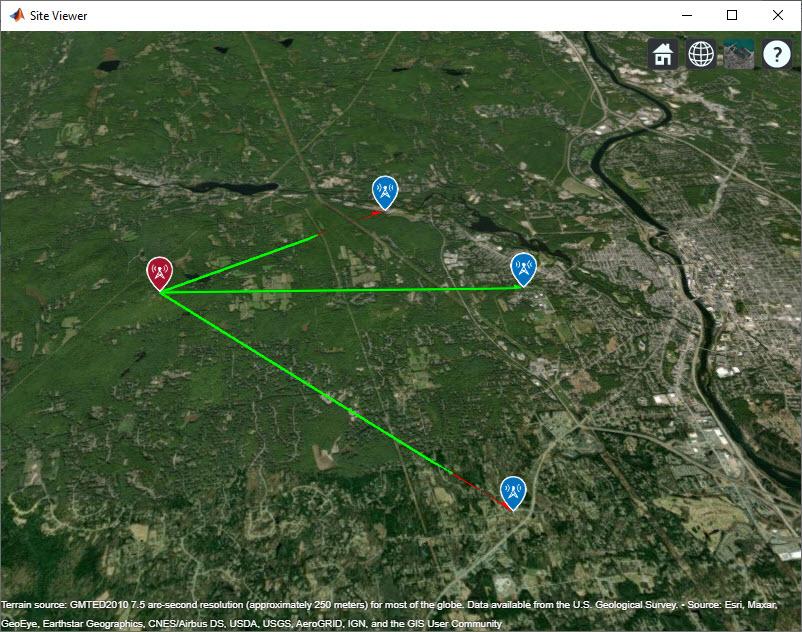
A challenge for 5G communication is achieving a successful link in the presence of terrain and other obstacles, since propagation losses increase at high frequency. A visible line-of-sight path is required for optimal propagation conditions. In the suburban environment considered here, terrain is the dominant obstacle to achieving line-of-sight visibility. Plot the line-of-sight propagation paths between the base station and receiver sites. The line-of-sight calculation includes terrain but no other obstacles and reveals obstructed line-of-sight with two of the three receiver sites.
los(tx,rxs)
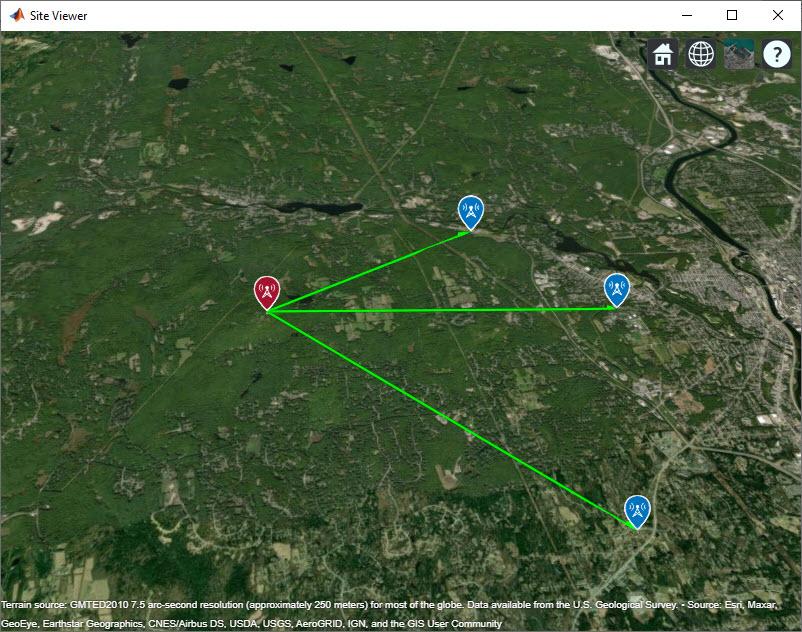
Adjust antenna heights in order to achieve line-of-sight visibility.
% Place antennas on structures at receiver sites. Assume 6 m utility poles for Bedford
% and St. Anselm sites, and 15 m antenna pole at Goffstown Police Department.
rxBedford.AntennaHeight = 6;
rxStA.AntennaHeight = 6;
rxGPD.AntennaHeight = 15;

% Increase height of antenna at base station until line-of-sight is achieved with all receiver sites
tx.AntennaHeight = 10;
while ~all(los(tx,rxs))
    tx.AntennaHeight = tx.AntennaHeight + 5;
end

% Display line-of-sight
los(tx,rxs)
disp("Antenna height required for line-of-sight: " + tx.AntennaHeight + " m")
Antenna height required for line-of-sight: 70 m
Create 8-by-12 Base Station Antenna Array
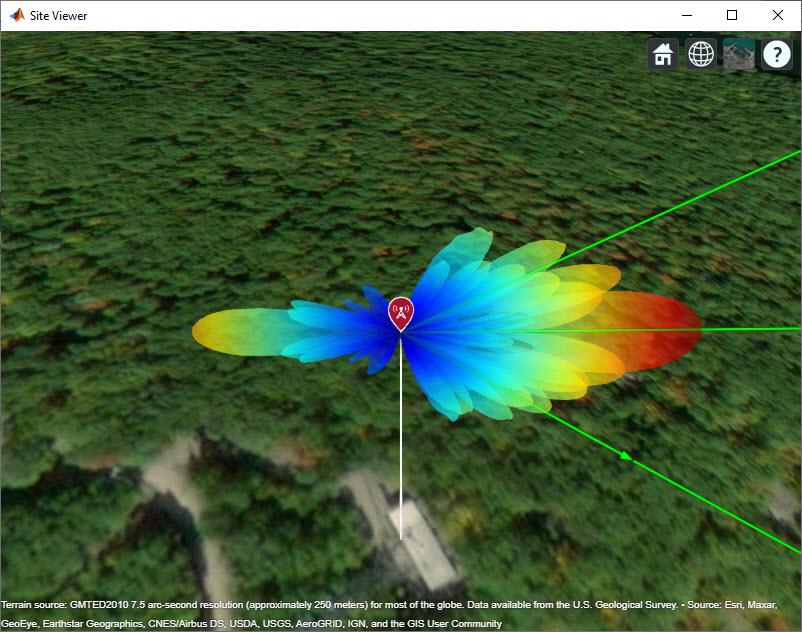
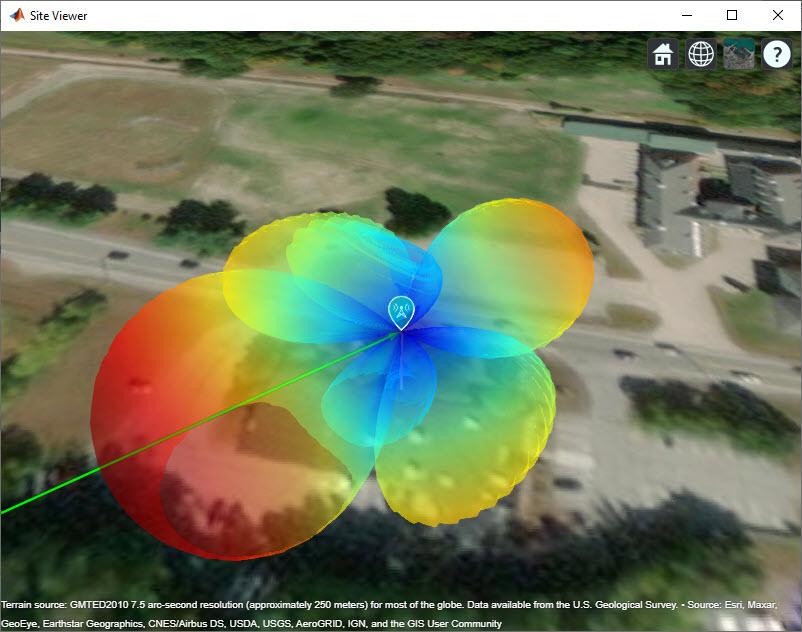
Design an 8-by-12 antenna array of crossed dipole antenna elements to generate a highly directive beam. This system implements a 5G concept utilizing MU-MIMO [1]. Plot the radiation pattern on the map, using the default antenna orientation so that the antenna array is physically oriented in the east direction.
% Design reflector-backed crossed dipole antenna
txElement = reflectorCrossedDipoleElement(fq);

% Define array size
ntxrow = 8;
ntxcol = 12;

% Define element spacing
lambda = physconst("lightspeed")/fq;
drow = lambda/2;
dcol = lambda/2;

% Create 8-by-12 antenna array
tx.Antenna = phased.URA("Size",[ntxrow ntxcol], ...
    "Element",txElement, ...
    "ElementSpacing",[drow dcol]);

% Plot pattern on the map
pattern(tx)
Create 3-by-3 Receiver Site Antenna Array
Create a 3-by-3 rectangular array from a reflector-backed vertical dipole antenna element. At each receiver site, point the array toward the base station and plot the radiation pattern on the map.
rxElement = reflectorDipoleElement(fq);

% Define array size
nrxrow = 3;
nrxcol = 3;

% Define element spacing
lambda = physconst("lightspeed")/fq;
drow = lambda/2;
dcol = lambda/2;

% Create antenna array
rxarray = phased.URA("Size",[nrxrow nrxcol], ...
    "Element",rxElement, ...
    "ElementSpacing",[drow dcol]);

% Assign array to each receiver site and point toward base station
for rx = rxs
    rx.Antenna = rxarray;
    rx.AntennaAngle = angle(rx, tx);
    pattern(rx,fq)
end
Predict Signal Strength in Free Space with Beamforming
Use the free space propagation model to compute received signal strength for each receiver site. For each site, steer the base station beam to optimize directivity for the link. The favorable conditions assumed by free space produce strong signals at the receiver sites, assuming a receiver sensitivity of -84 dBm [2].
steeringVector = phased.SteeringVector("SensorArray",tx.Antenna);
for rx = rxs
    % Compute steering vector for receiver site
    [az,el] = angle(tx,rx);
    sv = steeringVector(fq,[az;el]);

    % Update base station radiation pattern
    tx.Antenna.Taper = conj(sv);
    pattern(tx)

    % Compute signal strength (dBm)
    ss = sigstrength(rx,tx,"freespace");
    disp("Signal strength at " + rx.Name + ":")
    disp(ss + " dBm")
end
Signal strength at Bedford Town Center:
-69.6743 dBm
Signal strength at St. Anselm College:
-68.0441 dBm
Signal strength at Goffstown Police Dept:
-66.3306 dBm

Simultaneous Transmission
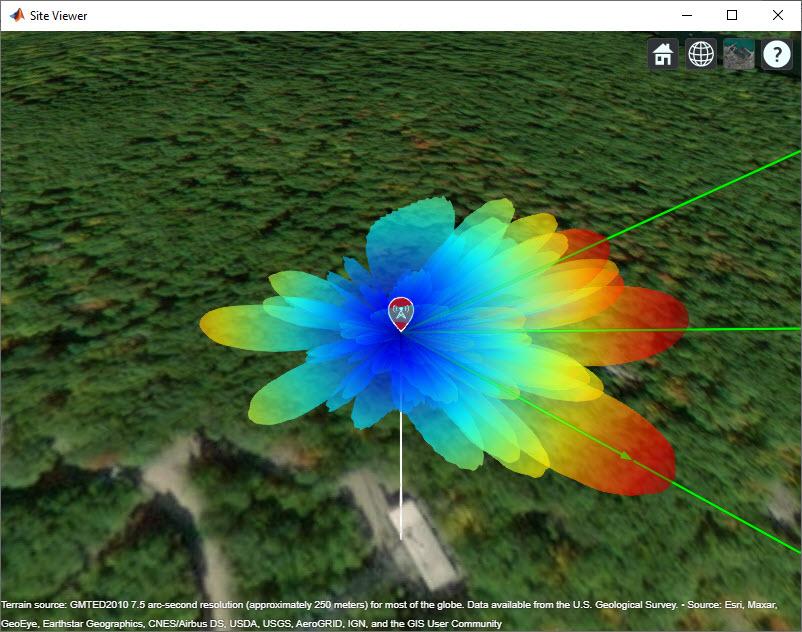
Instead of steering the base station antenna beam to each receiver site in turn, generate a single beam that can transmit to all receiver sites simultaneously. The single beam generates radiation lobes toward the three receiver sites. The signal strength drops at each receiver site with simultaneous transmission but still meets the receiver sensitivity.
steeringVector = phased.SteeringVector("SensorArray",tx.Antenna);

% Compute steering vector for receiver site
[az,el] = angle(tx,rxs);
sv = steeringVector(fq,[az el]');

% Update base station radiation pattern
tx.Antenna.Taper = conj(sum(sv,2));
pattern(tx)

% Compute signal strength (dBm)
for rx = rxs
    ss = sigstrength(rx,tx,"freespace");
    disp("Signal strength at " + rx.Name + ":")
    disp(ss + " dBm")
end
Signal strength at Bedford Town Center:
-75.2896 dBm
Signal strength at St. Anselm College:
-72.2968 dBm
Signal strength at Goffstown Police Dept:
-72.0328 dBm
Add Path Loss Impairments
Additional attenuation of the signal occurs due to foliage and weather. Use Weissberger's model [3] to estimate path loss due to foliage, and use the gas and rain propagation models to estimate signal strength due to weather. In the presence of path loss impairments, the estimated signal strength becomes weak and drops below the receiver sensitivity of -84 dBm.
% Assume that propagation path travels through 25 m of foliage
foliageDepth = 25;
L = 1.33*((fq/1e9)^0.284)*foliageDepth^0.588; % Weissberger model for d > 14
disp("Path loss due to foliage: " + L + " dB")
Path loss due to foliage: 22.7422 dB
% Assign foliage loss as static SystemLoss on each receiver site
for rx = rxs
    rx.SystemLoss = L;
end

% Compute signal strength with foliage loss
for rx = rxs
    rx.SystemLoss = L;
    ss = sigstrength(rx,tx,"freespace");
    disp("Signal strength at " + rx.Name + ":")
    disp(ss + " dBm")
end
Signal strength at Bedford Town Center:
-98.0318 dBm
Signal strength at St. Anselm College:
-95.0391 dBm
Signal strength at Goffstown Police Dept:
-94.775 dBm
% Compute signal strength including propagation through gas and rain. Use
% the "+" operator to add the propagation models to create a composite
% model including both atmospheric effects.
weatherpm = propagationModel("gas") + propagationModel("rain");
for rx = rxs
    ss = sigstrength(rx,tx,weatherpm);
    disp("Signal strength at " + rx.Name + ":")
    disp(ss + " dBm")
end
Signal strength at Bedford Town Center:
-114.4897 dBm
Signal strength at St. Anselm College:
-110.4526 dBm
Signal strength at Goffstown Police Dept:
-107.3242 dBm
Performance in the 3.5 GHz Band
The 3.5 GHz band is a prominent band under consideration for 5G radio [1]. Redesign the MU-MIMO system for this lower frequency to achieve more favorable path loss and achieve the required signal strength.
fq = 3.5e9; % 3.5 GHz

% Create antenna array for base station
lambda = physconst("lightspeed")/fq;
drow = lambda/2;
dcol = lambda/2;
tx.TransmitterFrequency = fq;
tx.Antenna = phased.URA("Size",[ntxrow ntxcol], ...
    "Element",reflectorCrossedDipoleElement(fq), ...
    "ElementSpacing",[drow dcol]);

% Create antenna array for receiver sites
lambda = physconst("lightspeed")/fq;
drow = lambda/2;
dcol = lambda/2;
rxarray = phased.URA("Size",[nrxrow nrxcol], ...
    "Element",reflectorDipoleElement(fq), ...
    "ElementSpacing",[drow dcol], ...
    "ArrayNormal","x");
for rx = rxs
    rx.Antenna = rxarray;
end
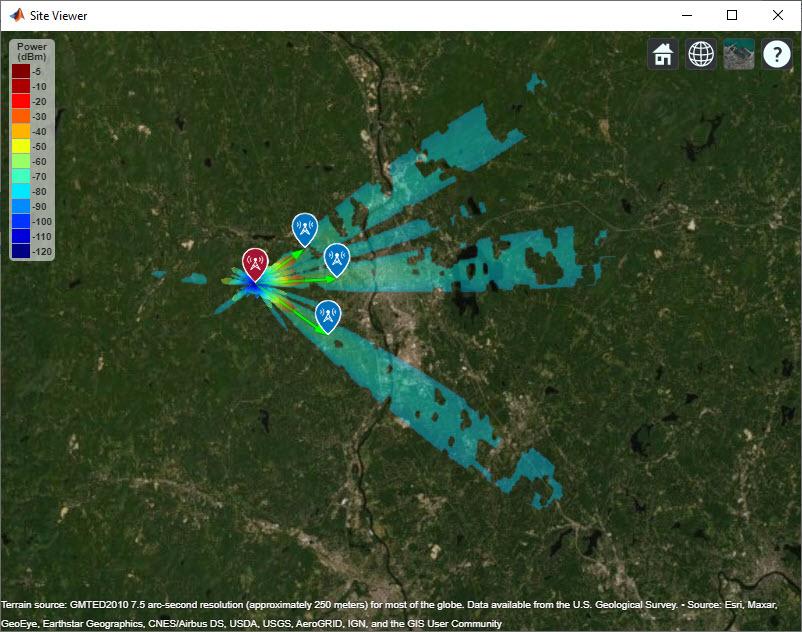
In addition to computing signal strength at each receiver site, generate a coverage map using the Longley-Rice propagation model with weather impairments. The Longley-Rice model, which is also known as the Irregular Terrain Model (ITM), estimates path loss based on diffraction and other losses derived from terrain. The Longley-Rice model is valid from 20 MHz to 20 GHz and is therefore available for 3.5 GHz but not for 28 GHz.
% Compute steering vector for receiver site
steeringVector = phased.SteeringVector("SensorArray",tx.Antenna);
[az,el] = angle(tx,rxs);
sv = steeringVector(fq,[az el]');

% Update base station radiation pattern
tx.Antenna.Taper = conj(sum(sv,2));
pattern(tx,'Size',4000)

% Recompute loss due to foliage
L = 1.33*((fq/1e9)^0.284)*foliageDepth^0.588; % Weissberger model for d > 14

% Assign foliage loss as static SystemLoss on each receiver site
for rx = rxs
    rx.SystemLoss = L;
end
disp("Path loss due to foliage: " + L + " dB")
Path loss due to foliage: 12.5996 dB
% Add weather-based path loss to the Longley-Rice propagation model
pm = propagationModel('longley-rice') + weatherpm;

% Compute receiver gain from peak antenna gain and system loss
G = pattern(rxarray, fq);
rxGain = max(G(:)) - L;

coverage(tx, ...
    'PropagationModel',pm, ...
    'ReceiverGain',rxGain, ...
    'ReceiverAntennaHeight',6, ...
    'SignalStrengths',-84:-50)

% Compute signal strength with foliage loss and weather
for rx = rxs
    ss = sigstrength(rx,tx,pm);
    disp("Signal strength at " + rx.Name + ":")
    disp(ss + " dBm")
end
Signal strength at Bedford Town Center:
-69.9048 dBm
Signal strength at St. Anselm College:
-66.8941 dBm
Signal strength at Goffstown Police Dept:
-66.6094 dBm
Summary
This example shows how to plan a fixed wireless access link over terrain using 5G technologies in a multi-user suburban scenario. While line-of-sight propagation is achieved over the terrain, path loss impairments render the 28 GHz carrier frequency unsuitable for the links despite the use of high gain antennas and beamforming. The addition of foliage loss alone drops the signal strength below the receiver sensitivity of -84 dBm, and the addition of weather loss significantly drops it further. The lower frequency of 3.5 GHz is required to achieve successful links at the multi-kilometer ranges considered here. As a result, this example illustrates the sensitivity of high 5G carrier frequencies to common path loss impairments.
References
[1] Ericsson Technology Review, Fixed wireless access on a massive scale with 5G, Anders Furuskär, Kim Laraqui, Sibel Tombaz, Ala Nazari, Björn Skubic, Elmar Trojer, December, 2016
[2] Microwave Journal, Pre-5G and 5G: Will The mmWave Link Work?, Andreas Roessler, December, 2017
[3] John Seybold, Introduction to RF Propagation, Wiley, 2005
function element = reflectorCrossedDipoleElement(fq, showAntenna)
%reflectorCrossedDipoleElement   Design reflector-backed crossed dipole antenna element

if nargin < 2
    showAntenna = false;
end

lambda = physconst("lightspeed")/fq;
offset = lambda/50;
gndspacing = lambda/4;
gndLength = lambda;
gndWidth = lambda;

% Design crossed dipole elements
d1 = design(dipole,fq);
d1.Tilt = [90,-45];
d1.TiltAxis = ["y","z"];
d2 = copy(d1);
d2.Tilt = 45;
d2.TiltAxis = "x";

% Design reflector
r = design(reflector,fq);
r.Exciter = d1;
r.GroundPlaneLength = gndLength;
r.GroundPlaneWidth = gndWidth;
r.Spacing = gndspacing;
r.Tilt = 90;
r.TiltAxis = "y";
if showAntenna
    show(r)
end

% Form the crossed dipole backed by reflector
refarray = conformalArray;
refarray.ElementPosition(1,:) = [gndspacing 0 0];
refarray.ElementPosition(2,:) = [gndspacing+offset 0 0];
refarray.Element = {r, d2};
refarray.Reference = "feed";
refarray.PhaseShift = [0 90];
if showAntenna
    show(refarray);
    view(65,20)
end

% Create custom antenna element from pattern
[g,az,el] = pattern(refarray,fq);
element = phased.CustomAntennaElement;
element.AzimuthAngles = az;
element.ElevationAngles = el;
element.MagnitudePattern = g;
element.PhasePattern = zeros(size(g));
end

function element = reflectorDipoleElement(fq)
%reflectorDipoleElement   Design reflector-backed dipole antenna element

% Design reflector and exciter, which is vertical dipole by default
element = design(reflector,fq);
element.Exciter = design(element.Exciter,fq);

% Tilt antenna element to radiate in xy-plane, with boresight along x-axis
element.Tilt = 90;
element.TiltAxis = "y";
element.Exciter.Tilt = 90;
element.Exciter.TiltAxis = "y";
end
See Also
Functions
Objects
txsite|rxsite|phased.URA(Phased Array System Toolbox) |phased.SteeringVector(Phased Array System Toolbox)