Review Polyspace Results on AUTOSAR Code
This topic describes a component-based approach to verifying AUTOSAR code with Polyspace®. For an integration analysis approach, see Choose Between Component-Based and Integration Analysis of AUTOSAR Code with Polyspace.
This tutorial describes how to open Polyspace Code Prover™ results for AUTOSAR-specific code and interpret results that highlight violation of data constraints in the ARXML.
Code Prover checks the code implementation of AUTOSAR software component-s for mismatch with specifications in the ARXML. For instance, if an RTE function argument has a value outside the constrained range defined in the ARXML, the analysis flags a possible issue.
Example Files
To follow the steps in this tutorial, run Polyspace on the demo files in polyspaceroot\polyspace\examples\doc_cxx\polyspace_autosar
Open Results
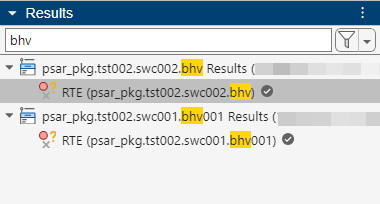
If you run the analysis in the Polyspace user interface, you can open each result directly. In the Results pane, Double-click the result that you want to open.

If you run the analysis by using scripts, after analysis, you can open the results in several ways.
Open the file
psar_project.xhtmlfrom your project folder in a web browser. You see an overview of results for all software components and navigate to results for each software component. Find more information in the section See Overview of Results for All Software Components.Open the file
psar_workspace.pswksfrom your workspace folder in the Polyspace Platform user interface. Open each result on the Results pane.Navigate to the folders containing the individual results files. Open a result file (with extension
.pscp) in the Polyspace Platform user interface.The results files are stored in the path
workspace/<psar_project>Results/RTE/run<timestamp>. Thepsar_projectis the fully qualified name of the internal behavior of the software component followed by an identifier for the. For instance, for a fully qualified namepkg.component.bhv, thepsar_projectcan bepsar_pkg.tst002.swc001.bhv001.
See Overview of Results for All Software Components
Before opening a specific result set, you might want to see an overview of results for all software components. Open the file psar_project.xhtml in the project folder on the machine where you run the analysis. If you are reviewing results from a different machine, you might not have access to this file.
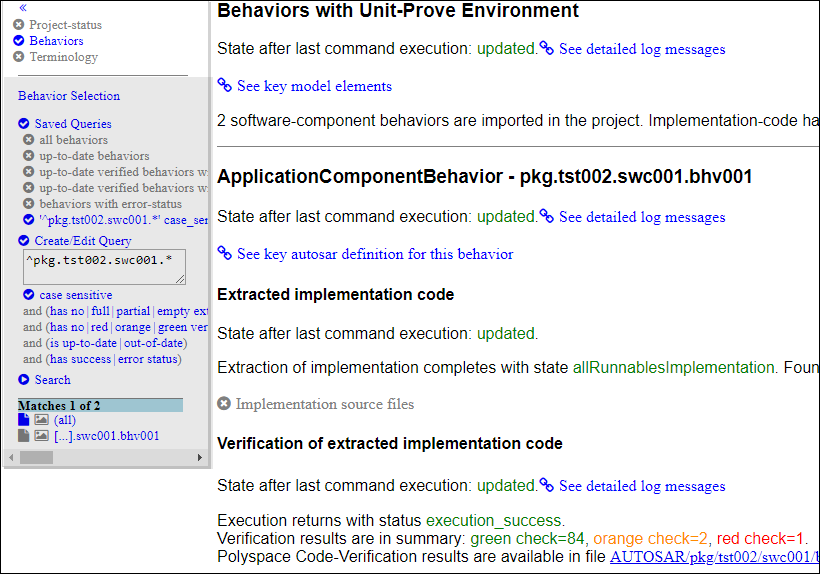
In the file psar_project.xhtml, click the ![]() icon on the upper left. On the left pane, click Behaviors. You can see the list of all software components whose internal behavior-s are extracted.
icon on the upper left. On the left pane, click Behaviors. You can see the list of all software components whose internal behavior-s are extracted.
You can filter this list to display only the software components that you are interested in. To see specific software components, in the search box, enter the fully qualified name of the software component that you are interested in.
You can also enter regular expressions to see multiple components. For instance, to see all components whose qualified names begin with pkg.tst002.swc001, enter the expression:
^pkg.tst002.swc001.*
Click Search. The list on the right displays only the software components that you queried for.
![]()

![]()
You can also filter out components based on other criteria:
Success or failure of verification
To see only software components that completed verification, click and then clear the error status filter.
Presence or absence of certain kinds of results, for instance, red checks
To see only software components that have red checks, click everything on the row containing the red filter except the red filter itself.
![]()
See Runnables and Source Files in Software Component
For each software component, you can see this information in the file psar_project.xhtml in your project folder (see the preceding figure).
The state of this software component with respect to the analysis. That is, whether the software component specification was parsed, its source code extracted, and then analyzed with Code Prover.
To make sure that the Code Prover analysis was complete, under the section Verification of extracted implementation code, look for this statement:
State after last command execution: updated.Functions provided by this software component and the
Rte_functions used.To see this list, click the link:
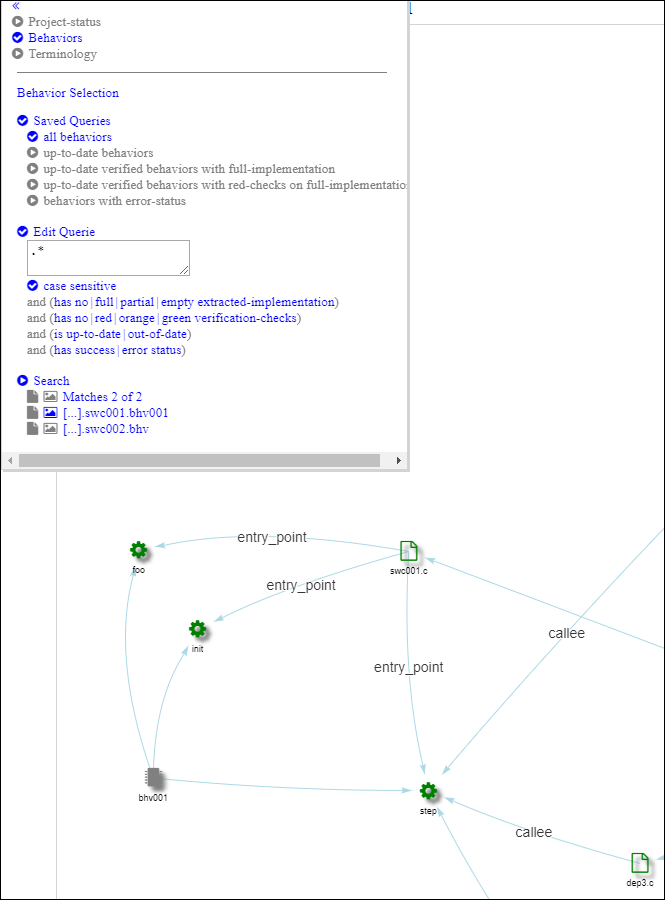
See key autosar definition for this behaviorGraphical view of runnables in the software component. The graphical view shows:
Entry-point functions implementing the runnables and their callees
Files containing these functions
To see this view, in the list of software components on the left pane, click the
 (behavior graph) icon for the software component you are interested in. To return from the graph to the textual description of the software component, click the
  (behavior page) icon.


In this example, you see that the software component with internal behavior
bhv001has three runnables implemented through the entry-point functionsfoo,init, andstep. All three entry-point functions are defined in the fileswc001.c.The function
stepcalls functions defined in other files, for instance,dep3.c. You can click the icon for
 stepto see only the files involved in the implementation of the runnablestep. To revert to the full graphical view of the software component, click anywhere in the blank space in the graph.
Overview of Code Prover results with links to the result files.
Look for lines like these lines:
Click the link following the line to open the result file in the Polyspace user interface. If you haven't opened aVerification results are in summary: green check=84, orange check=2, red check=1
.pscpfile before, clicking the link might simply download the result file. Make sure that.pscpfiles always open in the Polyspace user interface (with the executablepolyspaceroot\polyspace\binpolyspacerootThe results consist of AUTOSAR-specific run-time checks such as
Invalid result of AUTOSAR runnable implementationand general C/C++ run-time checks such asDivision by zero.
![]()
Interpret AUTOSAR Specific Run-time Checks for Software Component
![]()

![]()
On the Results List pane, select the result Invalid result of AUTOSAR runnable implementation or Invalid use of AUTOSAR runtime environment function. Investigate the result further by using the information on various panes.
![]()
Check Return Value and Arguments
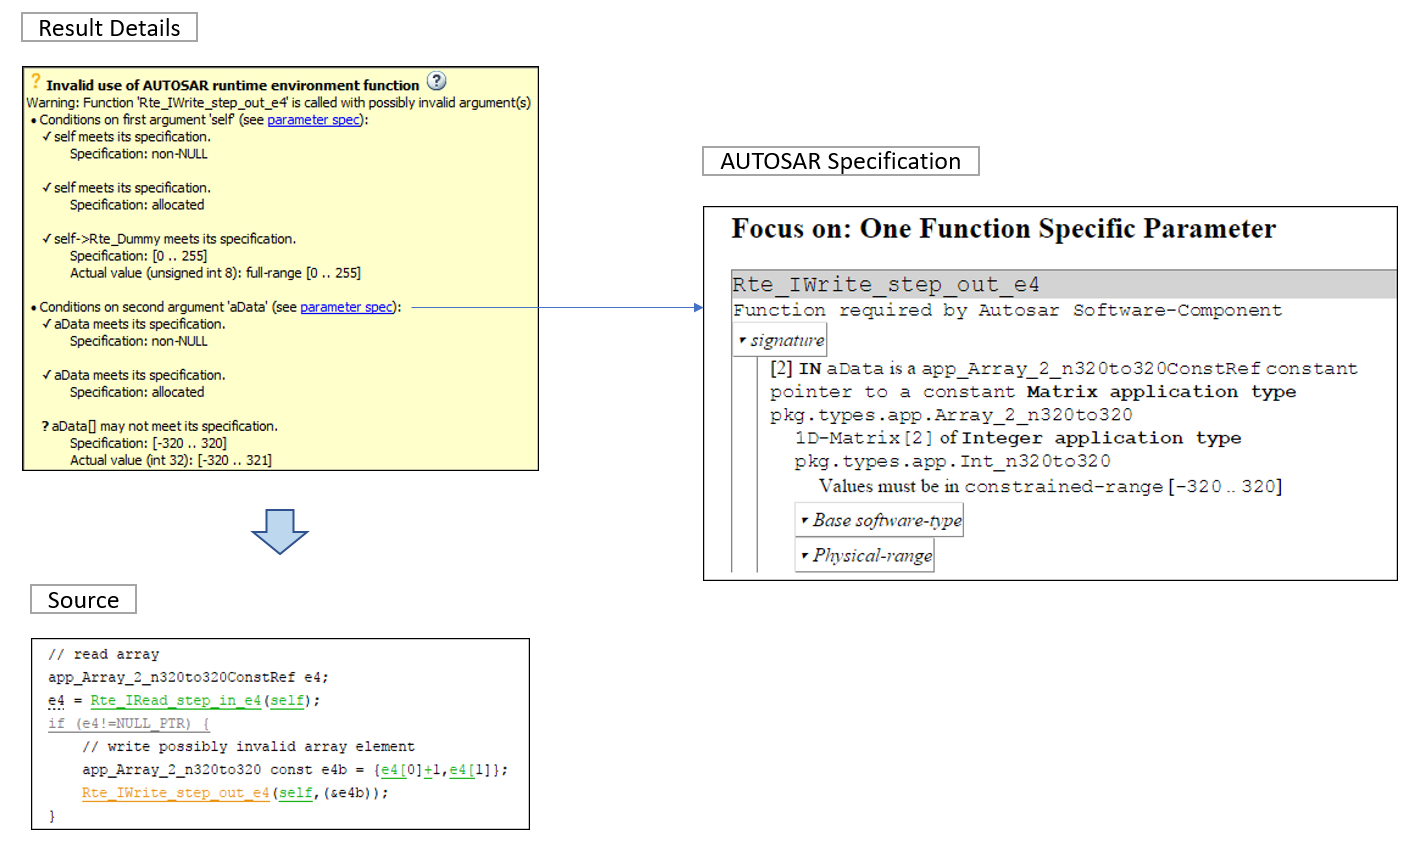
Using the information on the Result Details pane, determine whether the return value or an argument violates data constraints in the ARXML or can be NULL-valued. Look for the ! icon that indicates a definite error or the ? icon that indicates a possible error.
For the return value and each argument, you see the actual possible values at run time and the values allowed by the data type in the ARXML specification. Compare them and find the value that is not allowed.
The result Invalid result of AUTOSAR runnable implementation determines if the return value of the function implementing the runnable or the output arguments can violate the data constraints. The result Invalid use of AUTOSAR runtime environment function determines if the input arguments to an Rte_ function violates data constraints.
![]()
Check Argument Spec (Optional)
Sometimes, you might want to see the Application Data Type from which the variable Base Software Type originates. Click the blue parameter spec link and see the ARXML extract that describes this information about the parameter or return value data type:
Application Data Type, Implementation Data Type, and Base Software Type
Data Constraint, Unit, and Computation Method
![]()
Find Root Cause of Result
Investigate how the variable acquires the values that violate the data constraints. To trace back in your code, on the Source pane, right-click a variable and search for all its instances or navigate to its definition. For more tips, see Interpret Polyspace Code Prover Results in Polyspace Platform User Interface or Interpret Code Prover Results in Polyspace Access Web Interface (Polyspace Access).
Decide whether to fix your code or ARXML, or justify the result through comments. See Address Polyspace Results Through Bug Fixes or Justifications or Address Results in Polyspace Access Through Bug Fixes or Justifications (Polyspace Access).
![]()
See Also
Invalid result of AUTOSAR runnable implementation | Invalid use of AUTOSAR runtime environment function