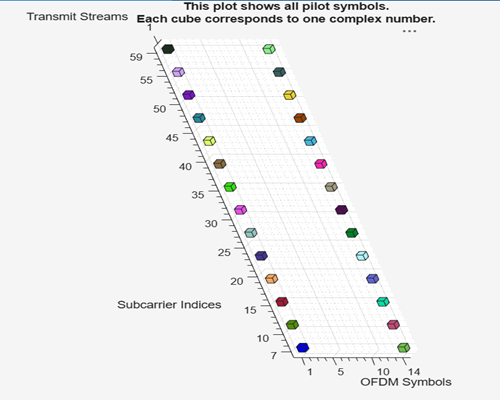
主要内容

plot

Plot pilot locations in 3-D

Since R2026a

Description

plot(pilotcfg) returns a 3-D plot of all pilot locations given in the pilotcfg input. Each cube represents one pilot symbol. Cubes of the same color in the plot show pilot symbols that form orthogonal vectors along the stream axis.

example

plot(pilotcfg,limits) plots pilot locations in the region specified by limits input argument.

Examples

collapse all

  1. Specify an OFDM pilot configuration using default values.

    pilotcfg = ofdmPilotConfig
    
    pilotcfg = 
    
      ofdmPilotConfig with properties:
    
                   FFTLength: 64
        NumGuardBandCarriers: [2×1 double]
                  NumSymbols: 14
          NumTransmitStreams: 1
                StreamGroups: {[1]}
              PilotLocations: {[1×2×28 double]}
                PilotSymbols: {[1×1×28 double]}
  2. Plot the configuration.

    plot(pilotcfg)
    

Input Arguments

collapse all

Pilot configuration object, specified as a ofdmPilotConfig object.

Limits of a plotting region, specified as a 2-element vector or a 4-element vector.

  • For the 2-element vector, [scMinIndex, scMaxIndex], plots pilot locations for all symbols in pilotcfg.NumSymbols and subcarriers, scMinIndex:scMaxIndex. The vector elements must satisfy 1<=scMinIndex<=scMaxIndex<=pilotcfg.FFTLength.

  • For the 4-element vector, [scMinIndex, scMaxIndex, symMinIndex, symMaxIndex], plots pilot locations for subcarriers scMinIndex:scMaxIndex and OFDM symbols symMinIndex:symMaxIndex. The vector elements must satisfy 1<=scMinIndex<=scMaxIndex<=pilotcfg.FFTLength and 1<=symMinIndex<=symMaxIndex<=pilotcfg.NumSymbols.

Data Types: double

Version History

Introduced in R2026a

See Also

Objects

Functions