MATLAB 帮助中心
绘制线性回归图
plotregression(targets,outputs)
plotregression(targs1,outs1,'name1',targs2,outs2,'name2',...)
plotregression(targets,outputs) 绘制 targets 对 outputs 的线性回归图。
targets
outputs
示例
plotregression(targs1,outs1,'name1',targs2,outs2,'name2',...) 生成多个图。
全部折叠
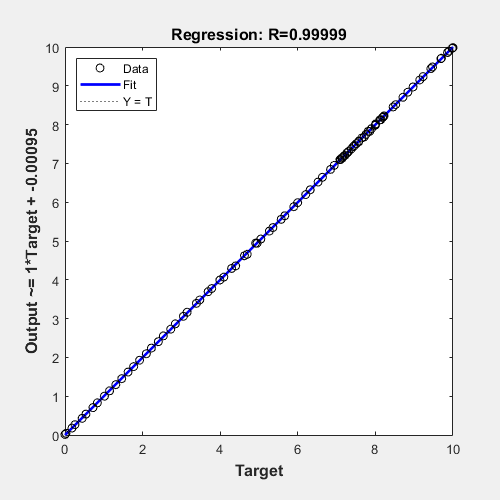
此示例说明如何绘制前馈网络的线性回归图。
[x,t] = simplefit_dataset; net = feedforwardnet(10); net = train(net,x,t);
y = net(x); plotregression(t,y,'Regression')
网络目标,指定为矩阵或元胞数组。
网络输出,指定为矩阵或元胞数组。
在 R2008a 中推出
plottrainstate
You clicked a link that corresponds to this MATLAB command:
Run the command by entering it in the MATLAB Command Window. Web browsers do not support MATLAB commands.
选择网站
选择网站以获取翻译的可用内容,以及查看当地活动和优惠。根据您的位置,我们建议您选择:。
您也可以从以下列表中选择网站:
如何获得最佳网站性能
选择中国网站(中文或英文)以获得最佳网站性能。其他 MathWorks 国家/地区网站并未针对您所在位置的访问进行优化。
美洲
欧洲
亚太
联系您当地的办事处