plotroc
绘制受试者工作特征图
说明
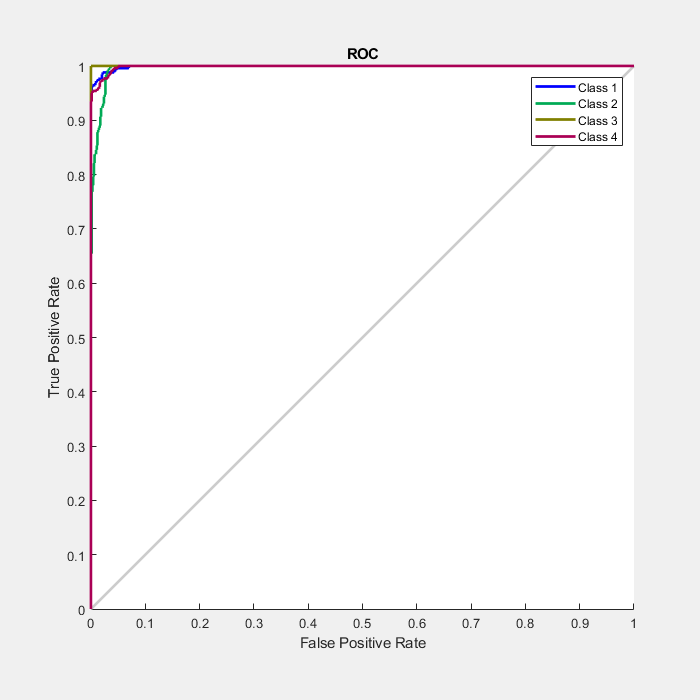
plotroc(
绘制每个输出类的受试者工作特征。每条曲线越靠近图的左边缘和上边缘,分类就越好。targets
,outputs
)
提示
plotroc
不支持分类目标。要绘制分类目标的 ROC 度量,请使用 rocmetrics
。
plotroc(targets1,outputs2,'name1',...)
生成多个图。
示例
输入参数
targets
— 网络目标
矩阵 | 元胞数组
网络目标,指定为矩阵或元胞数组。
outputs
— 网络输出
矩阵 | 元胞数组
网络输出,指定为矩阵或元胞数组。
版本历史记录
在 R2008a 中推出
另请参阅
MATLAB 命令
您点击的链接对应于以下 MATLAB 命令:
请在 MATLAB 命令行窗口中直接输入以执行命令。Web 浏览器不支持 MATLAB 命令。
Select a Web Site
Choose a web site to get translated content where available and see local events and offers. Based on your location, we recommend that you select: .
You can also select a web site from the following list:
How to Get Best Site Performance
Select the China site (in Chinese or English) for best site performance. Other MathWorks country sites are not optimized for visits from your location.
Americas
- América Latina (Español)
- Canada (English)
- United States (English)
Europe
- Belgium (English)
- Denmark (English)
- Deutschland (Deutsch)
- España (Español)
- Finland (English)
- France (Français)
- Ireland (English)
- Italia (Italiano)
- Luxembourg (English)
- Netherlands (English)
- Norway (English)
- Österreich (Deutsch)
- Portugal (English)
- Sweden (English)
- Switzerland
- United Kingdom (English)