plotsomnc
绘制自组织映射邻点连接
语法
plotsomnc(net)
说明
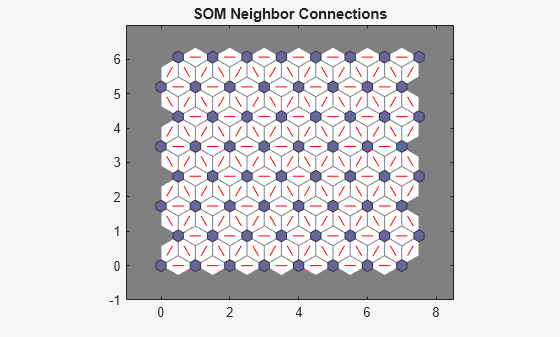
plotsomnc(net) 绘制 SOM 层,其中神经元显示为灰蓝色补片,其直接邻点关系显示为红线。
此图支持具有 hextop 和 gridtop 拓扑(但不支持具有 tritop 或 randtop 拓扑)的 SOM 网络。
示例
绘制 SOM 邻点连接
x = iris_dataset;
net = selforgmap([8 8]);
net = train(net,x);
plotsomnc(net)
版本历史记录
在 R2008a 中推出