Refine Cellpose Segmentation by Tuning Model Parameters
This example shows how to use options in the segmentCells2D (Medical Imaging Toolbox) function to improve the segmentation results from a Cellpose model. To learn how to select a suitable model, see Choose Pretrained Cellpose Model for Cell Segmentation (Medical Imaging Toolbox).
This example requires the Medical Imaging Toolbox™ Interface for Cellpose Library. You can install the Medical Imaging Toolbox Interface for Cellpose Library from Add-On Explorer. For more information about installing add-ons, see Get and Manage Add-Ons. The Medical Imaging Toolbox Interface for Cellpose Library requires Deep Learning Toolbox™ and Computer Vision Toolbox™.
Load Image
Read and display an image. This example uses an image small enough to fit into memory. If you are working with very large images, such as whole slide images, see Detect Nuclei in Large Whole Slide Images Using Cellpose (Medical Imaging Toolbox).
img = imread("AT3_1m4_01.tif");
imshow(img)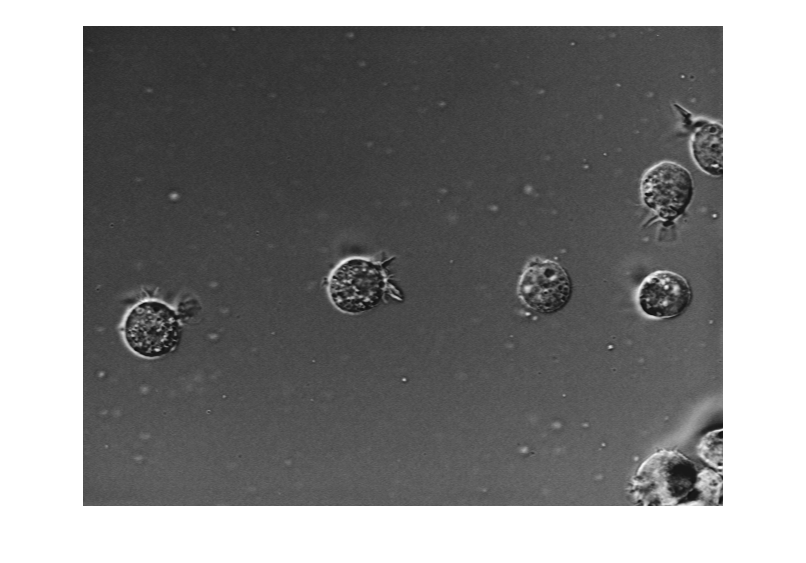
Configure Cellpose Model
Create a cellpose (Medical Imaging Toolbox) object that uses the cyto2 pretrained model from the Cellpose Library. Specify the average cell diameter in pixels. For an example showing how to measure the approximate diameter in the Image Viewer app, see Choose Pretrained Cellpose Model for Cell Segmentation (Medical Imaging Toolbox).
cp = cellpose(Model="cyto2");
averageCellDiameter = 56;
Segment Image Using Default Settings
Segment the image using the default model settings, specifying only the model name and the average cell diameter to configure the model. The default model generally does a good job labeling each cell, but the labels exclude the cell membrane protrusions. The remaining sections of this example show you how to tune additional parameters to refine the labels.
labelsDefault = segmentCells2D(cp,img,ImageCellDiameter=averageCellDiameter);
loverlayDefault = labeloverlay(img,labelsDefault);
imshow(loverlayDefault)

Visualize Impact of Cell Probability Threshold
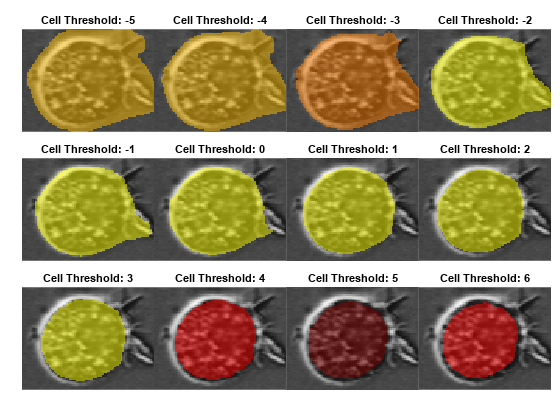
Visualize the effect of adjusting the CellThreshold name-value argument of the segmentCells2D function. The model applies this threshold value to the network output, and includes only pixels above the threshold in the label predictions. For most images, a suitable value ranges from –6 to 6.
Specify the range of CellThreshold values to investigate as –5 to 6, in increments of 1.
ctRange = -5:1:6;
For each value to investigate, segment the image using that CellThreshold value and display the result for one representative cell. View the results for all values as a tiled image display.
numResults = numel(ctRange);
numRows = round(sqrt(numResults));

figure
tiledlayout(numRows,ceil(numResults/numRows),TileSpacing="none",Padding="tight")

for ind = 1:numResults
    labels = segmentCells2D(cp,img, ...
        ImageCellDiameter=averageCellDiameter, ...
        CellThreshold=ctRange(ind), ...
        FlowErrorThreshold=10);

    loverlay = labeloverlay(img,labels);

    nexttile
    imshow(loverlay)
    title("Cell Threshold: " + num2str(ctRange(ind)))
end
linkaxes(findobj(gcf,Type="axes"))
In general, decreasing the CellThreshold value results in more cells being detected, but can generate less accurate boundaries between cells. Increasing this value generates clean boundaries, but can miss some cells or regions within a cell. The optimal value depends on your application and what regions of the cell you want to include. The rest of the example uses a cell threshold value of –2 to balance including cell membrane protrusions with tightly following the cell boundary.
xlim([235 320])
ylim([226 292])
Visualize Impact of Flow Error Threshold
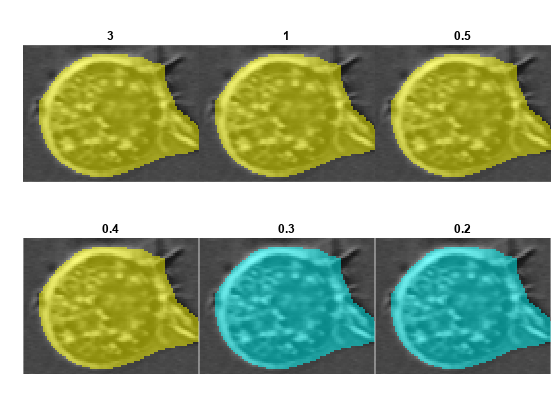
Visualize the effect of adjusting the FlowErrorThreshold name-value argument of the segmentCells2D function. The function applies the flow error threshold to flow fields, which are an intermediate network output used to compute the final label masks. For most images, a suitable value ranges from 0.1 to 3.
Specify the FlowErrorThreshold values to investigate. Based on the results from the previous section, set the CellThreshold to –2.
ct = -2;
ftRange = [3 1 0.5 0.4 0.3 0.2];
For each value to investigate, segment the image using that FlowErrorThreshold value and display the result for one representative cell. View the results for all values as a tiled image display.
numResults = numel(ftRange);

results = cell(1,numResults);
numRows = round(sqrt(numResults));

figure
tiledlayout(numRows,ceil(numResults/numRows),TileSpacing="none",Padding="tight")

for ind = 1:numResults
    labels = segmentCells2D(cp,img, ...
        ImageCellDiameter=averageCellDiameter, ...
        CellThreshold=ct, ...
        FlowErrorThreshold=ftRange(ind));

    loverlay = labeloverlay(img,labels);

    nexttile
    imshow(loverlay)
    title(num2str(ftRange(ind)))
end
linkaxes(findobj(gcf,Type="axes"))
In general, decreasing the FlowErrorThreshold value generates cleaner boundaries, but can miss some cells or regions of a cell. Increasing this value results in more cells being detected, but can generate less accurate boundaries between cells. The optimal value depends on your application and what regions of the cell you want to include. The rest of the example uses a flow error threshold value of 0.4.
xlim([235 320])
ylim([226 292])
Visualize Impact of Tiling and Augmentation
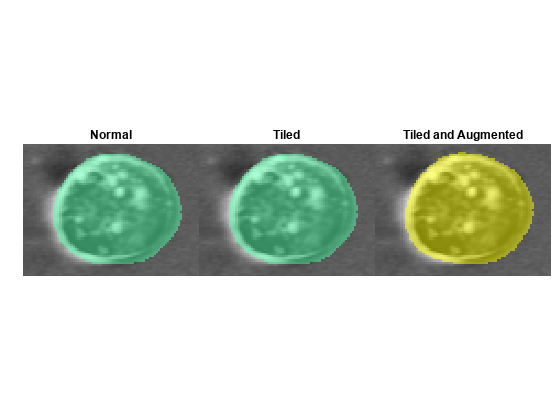
Cellpose models can generally detect and label cells with varied shapes, positions, and rotations. For some data sets, applying tiling and augmentation during segmentation can improve accuracy, but at the cost of longer segmentation times. When you use these techniques, the segmentCells2D (Medical Imaging Toolbox) function makes multiple predictions for some pixels, and averages the predictions to generate the final output. Averaging can improve accuracy by reducing random errors that occur in individual predictions.
Apply tiling by specifying the Tile name-value argument as True. The segmentCells2D function divides the input image into overlapping 224-by-224 pixel tiles. The function predicts labels for each tile individually and averages the results for the overlapping regions. Control the amount of overlap by specifying the TileOverlap name-value argument. For most images, a suitable value ranges from 0.1 (10% overlap) to 0.5 (50% overlap). For this example, specify the TileOverlap value as 0.5.
Based on the results from the previous section, set the CellThreshold to –2 and the FlowErrorThreshold to 0.4.
ft = 0.4;

tileLabels = segmentCells2D(cp,img, ...
    ImageCellDiameter=averageCellDiameter, ...
    CellThreshold=ct, ...
    FlowErrorThreshold=ft, ...
    Tile=true, ...
    TileOverlap=0.5);
Apply augmentation by specifying the TileAndAugment name-value argument as true. The segmentCells2D function automatically applies tiling with a 50% overlap and applies random flips and rotations to the tiles. The function predicts labels for each tile individually and averages the results for the overlapping regions.
augLabels = segmentCells2D(cp,img, ...
    ImageCellDiameter=averageCellDiameter, ...
    CellThreshold=ct, ...
    FlowErrorThreshold=ft, ...
    TileAndAugment=true);
Visually compare the labels computed without tiling or augmentation, those computed with tiling only, and those computed with tiling and augmentation. Compute labels without tiling or augmentation, then display the results from each computation method for one representative cell as a tiled image display.
labels = segmentCells2D(cp,img, ...
    ImageCellDiameter=averageCellDiameter, ...
    CellThreshold=ct, ...
    FlowErrorThreshold=ft);

figure
tiledlayout(1,3,TileSpacing="none",Padding="tight")
nexttile
imshow(labeloverlay(img,labels))
title("Normal")
nexttile
imshow(labeloverlay(img,tileLabels))
title("Tiled")
nexttile
imshow(labeloverlay(img,augLabels))
title("Tiled and Augmented")
linkaxes(findobj(gcf,Type="axes"))

xlim([540 620])
ylim([240 300])
Visualize Impact of Model Ensembling
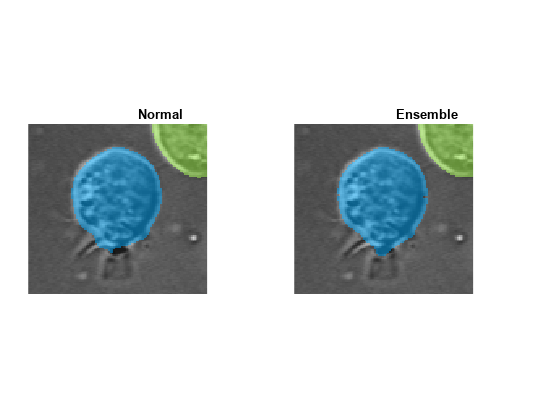
For some pretrained models, including cyto, cyto2, and nuclei, the Cellpose Library offers multiple versions of the model that have been trained using different initial parameter values. Set the UseEnsemble name-value argument when creating a new cellpose object to configure the model to use ensembling. When segmenting images, the segmentCells2D function predicts labels for each version of the model, and averages the results across the ensemble. Using a model ensemble can increase accuracy, but takes longer to segment images.
Create a cellpose object that uses the cyto2 model ensemble.
cpEnsemble = cellpose(Model="cyto2",UseEnsemble=true);Segment the image using the model ensemble.
enLabels = segmentCells2D(cpEnsemble,img, ...
    ImageCellDiameter=averageCellDiameter, ...
    CellThreshold=ct, ...
    FlowErrorThreshold=ft);
Visually compare the labels computed using the normal and ensembled cyto2 models. Display the results from each model for one representative cell as a tiled image display.
figure
tiledlayout(1,2,TileSpacing="none",Padding="tight")
nexttile
imshow(labeloverlay(img,labels))
title("Normal")
nexttile
imshow(labeloverlay(img,enLabels))
title("Ensemble")

linkaxes(findobj(gcf,Type="axes"))
xlim([530 694])
ylim([120 225])
Interactively Explore Parameters
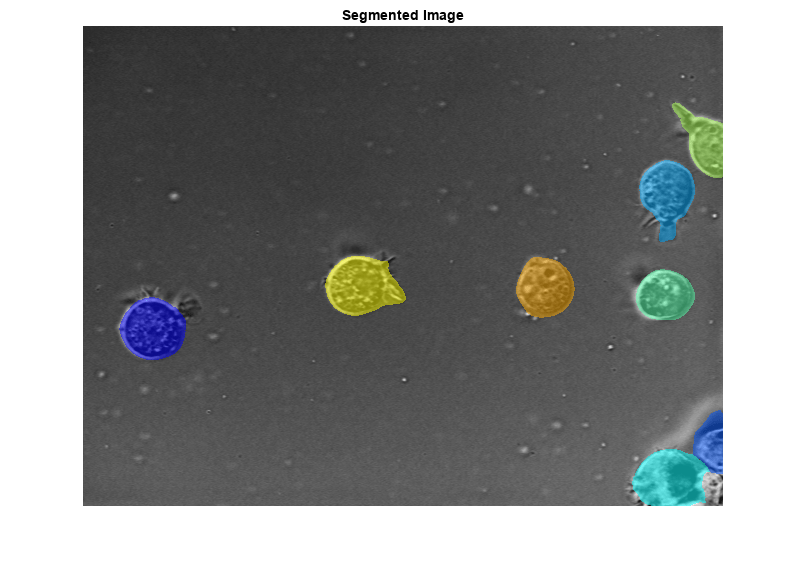
Try segmenting the image using different combinations of argument values. When creating the cellpose object, select a different model or enable ensembling to see how they affect the result. When performing segmentation, you can adjust the cell diameter (in pixels), the cell threshold, and the flow error threshold, as well as enable tiling or tiling with augmentation. Note that if you specify TileAndAugment as true, the segmentCells2D function automatically tiles the image, regardless of the value of Tile.
Each time you adjust a value, the display updates to show the label predictions. To restore the default value for an argument, right-click the argument value and select Restore Default Value.
cpl = cellpose(Model="cyto2",UseEnsemble=
true); labelsl = segmentCells2D(cpl,img, ... ImageCellDiameter=
56, ... CellThreshold=
-2, ... FlowErrorThreshold=
0.4, ... Tile=
false, ... TileOverlap=
0.1, ... TileAndAugment=
true); figure imshow(labeloverlay(img,labelsl)) title("Segmented Image")
References
[1] Stringer, Carsen, Tim Wang, Michalis Michaelos, and Marius Pachitariu. “Cellpose: A Generalist Algorithm for Cellular Segmentation.” Nature Methods 18, no. 1 (January 2021): 100–106. https://doi.org/10.1038/s41592-020-01018-x.
[2] Pachitariu, Marius, and Carsen Stringer. “Cellpose 2.0: How to Train Your Own Model.” Nature Methods 19, no. 12 (December 2022): 1634–41. https://doi.org/10.1038/s41592-022-01663-4.
See Also
cellpose (Medical Imaging Toolbox) | segmentCells2D (Medical Imaging Toolbox) | segmentCells3D (Medical Imaging Toolbox) | trainCellpose (Medical Imaging Toolbox) | downloadCellposeModels (Medical Imaging Toolbox)
Topics
- Choose Pretrained Cellpose Model for Cell Segmentation
- Train Custom Cellpose Model
- Detect Nuclei in Large Whole Slide Images Using Cellpose