pathPlotter
Path plotter for bird's-eye plot
Description
pPlotter = pathPlotter(bep)PathPlotter object that configures the display of actor paths
on a bird's-eye plot. The PathPlotter object is stored in the
Plotters property of the input birdsEyePlot object, bep. To display the paths, use the
plotPath function.
pPlotter = pathPlotter(bep,Name,Value)Name,Value pair arguments. For
example, pathPlotter(bep,'DisplayName','Actor paths') sets the display
name that appears in the bird's-eye-plot legend.
Examples
Create a 3-meter-wide lane.
lb = parabolicLaneBoundary([-0.001,0.01,1.5]);
rb = parabolicLaneBoundary([-0.001,0.01,-1.5]);
Compute the lane boundary model manually from 0 to 30 meters along the x-axis.
xWorld = (0:30)';
yLeft = computeBoundaryModel(lb,xWorld);
yRight = computeBoundaryModel(rb,xWorld);
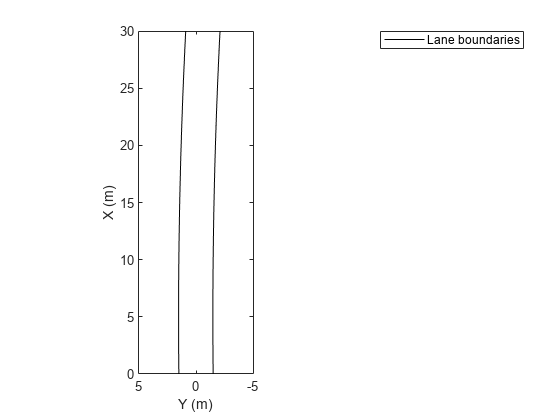
Create a bird's-eye plot and lane boundary plotter. Display the lane information on the bird's-eye plot.
bep = birdsEyePlot('XLimits',[0 30],'YLimits',[-5 5]);
lanePlotter = laneBoundaryPlotter(bep,'DisplayName','Lane boundaries');
plotLaneBoundary(lanePlotter,{[xWorld,yLeft],[xWorld,yRight]});
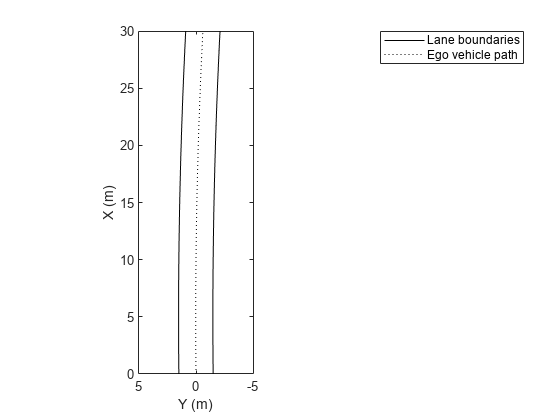
Create a path plotter. Create and display the path of an ego vehicle that travels through the center of the lane.
yCenter = (yLeft + yRight)/2;
egoPathPlotter = pathPlotter(bep,'DisplayName','Ego vehicle path');
plotPath(egoPathPlotter,{[xWorld,yCenter]});
Input Arguments
Name-Value Arguments
Specify optional pairs of arguments as
Name1=Value1,...,NameN=ValueN, where Name is
the argument name and Value is the corresponding value.
Name-value arguments must appear after other arguments, but the order of the
pairs does not matter.
Before R2021a, use commas to separate each name and value, and enclose
Name in quotes.
Example: pathPlotter('Color','red') sets the color of the path to
red.
Plotter name to display in legend, specified as the comma-separated pair consisting of
'DisplayName' and character vector or string scalar. If you do
not specify a name, the bird's-eye plot does not display a legend entry for the
plotter.
Path color, specified as the comma-separated pair consisting of
'Color' and an RGB triplet, a hexadecimal color code, a color
name, or a short color name.
For a custom color, specify an RGB triplet or a hexadecimal color code.
An RGB triplet is a three-element row vector whose elements specify the intensities of the red, green, and blue components of the color. The intensities must be in the range
[0,1], for example,[0.4 0.6 0.7].A hexadecimal color code is a string scalar or character vector that starts with a hash symbol (
#) followed by three or six hexadecimal digits, which can range from0toF. The values are not case sensitive. Therefore, the color codes"#FF8800","#ff8800","#F80", and"#f80"are equivalent.
Alternatively, you can specify some common colors by name. This table lists the named color options, the equivalent RGB triplets, and the hexadecimal color codes.
| Color Name | Short Name | RGB Triplet | Hexadecimal Color Code | Appearance |
|---|---|---|---|---|
"red" | "r" | [1 0 0] | "#FF0000" |
|
"green" | "g" | [0 1 0] | "#00FF00" |
|
"blue" | "b" | [0 0 1] | "#0000FF" |
|
"cyan"
| "c" | [0 1 1] | "#00FFFF" |
|
"magenta" | "m" | [1 0 1] | "#FF00FF" |
|
"yellow" | "y" | [1 1 0] | "#FFFF00" |
|
"black" | "k" | [0 0 0] | "#000000" |
|
"white" | "w" | [1 1 1] | "#FFFFFF" |
|
"none" | Not applicable | Not applicable | Not applicable | No color |
This table lists the default color palettes for plots in the light and dark themes.
| Palette | Palette Colors |
|---|---|
Before R2025a: Most plots use these colors by default. |
|
|
|
You can get the RGB triplets and hexadecimal color codes for these palettes using the orderedcolors and rgb2hex functions. For example, get the RGB triplets for the "gem" palette and convert them to hexadecimal color codes.
RGB = orderedcolors("gem");
H = rgb2hex(RGB);
Before R2023b: Get the RGB triplets using RGB =
get(groot,"FactoryAxesColorOrder").
Before R2024a: Get the hexadecimal color codes using H =
compose("#%02X%02X%02X",round(RGB*255)).
Path line style, specified as the comma-separated pair consisting of
'LineStyle' and one of the options listed in this table.
| Line Style | Description | Resulting Line |
|---|---|---|
"-" | Solid line |
|
"--" | Dashed line |
|
":" | Dotted line |
|
"-." | Dash-dotted line |
|
"none" | No line | No line |
Tag associated with the plotter object, specified as the comma-separated pair
consisting of 'Tag' and a character vector or string scalar. The
default value is 'Plotter, where
N'N is an integer that corresponds to the
Nth plotter associated with the input birdsEyePlot object.
Output Arguments
Version History
Introduced in R2017a
See Also
birdsEyePlot | plotPath | findPlotter | clearData | clearPlotterData