plotPath
Display actor paths on bird’s-eye plot
Description
plotPath(
displays the paths of actors from a list of path coordinates on a bird's-eye
plot. The path plotter object, pPlotter,pathCoords)pPlotter, is associated with
a birdsEyePlot object and
configures the display of the specified path.
To remove all paths associated with the path plotter
pPlotter, call the clearData function and specify pPlotter as
the input argument.
Examples
Create a 3-meter-wide lane.
lb = parabolicLaneBoundary([-0.001,0.01,1.5]);
rb = parabolicLaneBoundary([-0.001,0.01,-1.5]);
Compute the lane boundary model manually from 0 to 30 meters along the x-axis.
xWorld = (0:30)';
yLeft = computeBoundaryModel(lb,xWorld);
yRight = computeBoundaryModel(rb,xWorld);
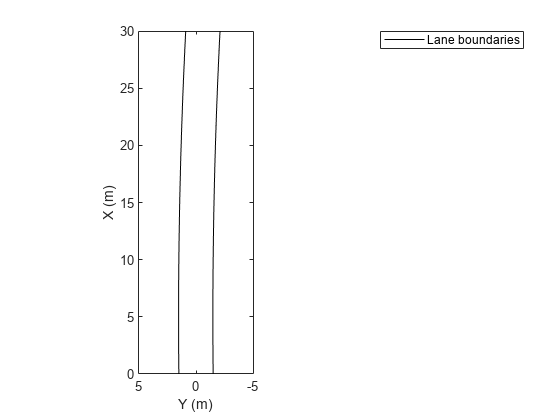
Create a bird's-eye plot and lane boundary plotter. Display the lane information on the bird's-eye plot.
bep = birdsEyePlot('XLimits',[0 30],'YLimits',[-5 5]);
lanePlotter = laneBoundaryPlotter(bep,'DisplayName','Lane boundaries');
plotLaneBoundary(lanePlotter,{[xWorld,yLeft],[xWorld,yRight]});
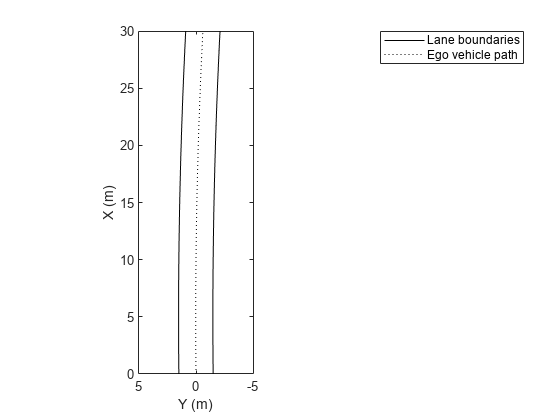
Create a path plotter. Create and display the path of an ego vehicle that travels through the center of the lane.
yCenter = (yLeft + yRight)/2;
egoPathPlotter = pathPlotter(bep,'DisplayName','Ego vehicle path');
plotPath(egoPathPlotter,{[xWorld,yCenter]});
Input Arguments
Path plotter, specified as a PathPlotter object. This
object is stored in the Plotters property of a birdsEyePlot object and
configures the display of the specified actor paths in the bird's-eye plot.
To create this object, use the pathPlotter
function.
Path coordinates, specified as a cell array of M-by-2 real-valued matrices. Each matrix represents the coordinates for a different path. M is the number of coordinates in a path and can be different for each path. The first and second columns of each matrix represent the (X, Y) positions of the path curve. The positive X-direction points ahead of the center of the vehicle. The positive Y-direction points to the left of the origin of the vehicle, which is the center of the rear axle, as shown in this figure of the vehicle coordinate system..
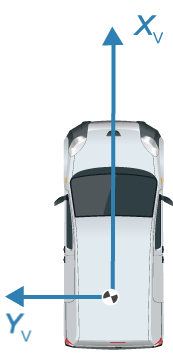
Path coordinates are relative to the ego vehicle.
Version History
Introduced in R2017a