Evaluate Fault Combinations on a Fault-Tolerant Fuel System
This example shows how to simulate faults on a fault-tolerant control system to check the effects of fault combinations and validate a Failure Mode and Effects Analysis (FMEA). For more information on creating faults, see Define and Model Faults. You can simulate combinations of faults to determine their effects on model behavior by using the Multiple Simulations panel. After configuring faults, you can link faults to safety analysis spreadsheets, run simulations from the spreadsheet, and analyze the spreadsheet by using the simulation results.
Open the Model
Open the sldemo_fuelsys_fault_analyzer model and set up the faults, conditionals, and links by using the fuelSysFaultSetup helper function. The helper function deletes the existing Simulink® Fault Analyzer™ model artifacts and replaces them with the faults used in the example.
mdlName = "sldemo_fuelsys_fault_analyzer";
open_system(mdlName)
fuelSysFaultSetup
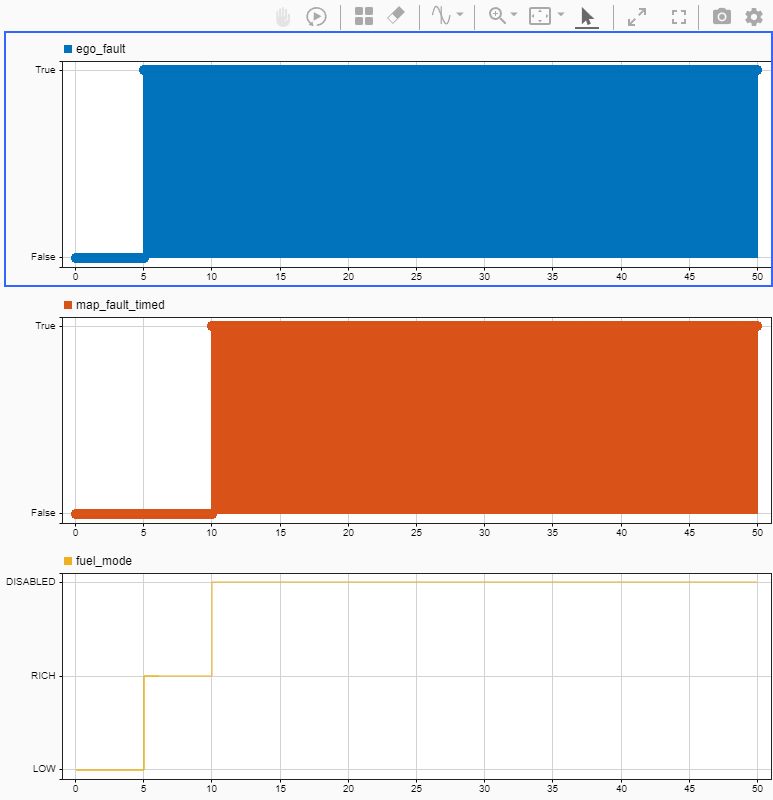
The model represents a fuel control system for a gasoline engine, and is a modified version of the model in Model Fault-Tolerant Fuel Control System. The model produces a fuel mode signal after detecting faults in the controller. When the controller detects a single fault, the controller changes the fuel mode signal, fuel_mode, to LOW, which represents low emissions, to RICH, which represents a rich mixture. When the controller detects a second fault, it sets fuel_mode to DISABLED.
After executing the helper function, the model contains three faults. Open the Fault Table pane to view the faults. In the Apps tab, click Fault Analyzer. Then, in the Fault Analyzer tab, in the View section, click Fault Table. Expand each model element to view the faults. The ego_fault and the map_fault_timed faults use a timed trigger, and the map_fault_conditional uses a conditional trigger. ego_fault is injected when the simulation time is 5, and map_fault_timed is injected when the simulation time is 10.

To view the conditional, in the Fault Table pane, in the Conditional tab, right-click the conditional throttle_HIGH and click Properties. The properties open in the Property Inspector. The conditional trigger assigned to map_fault_conditional is true if the throttle signal is greater than 18. When this condition is true, the fault is injected.
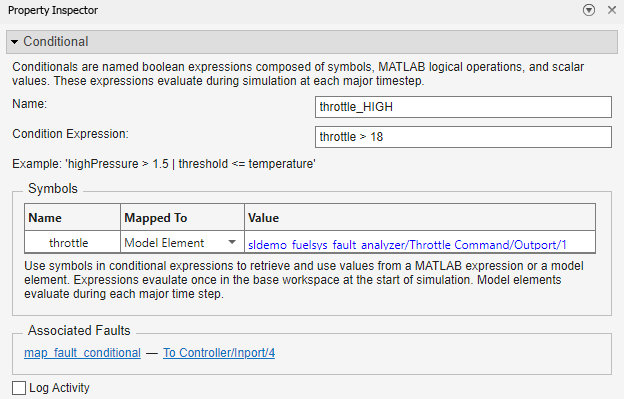
As you develop your conditionals, you may find that you need to update expressions to better represent fault injection conditions. You can adjust the signal threshold by adjusting the condition expression. For more information, see Create and Manage Conditionals.
Simulate Fault Combinations Manually
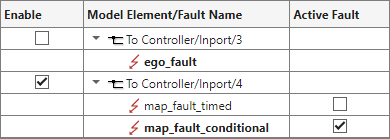
You can simulate one, several, or no faults in a given simulation. For example, to simulate only the map_fault_conditional fault, enable the To Controller/Inport/4 model element, disable To Controller/Inport/3 model element, and activate map_fault_conditional.
In the Fault Analyzer tab, in the Status Section, ensure the Fault Simulation button is enabled. Simulate the model. You can view the results of the simulation in the Simulation Data Inspector. In the Fault Analyzer tab, in the Review Results section, click Data Inspector. This image shows the injection status of the fault and the fuel_mode signal.

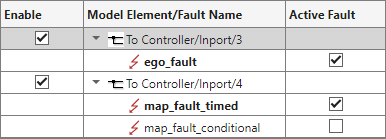
Next, simulate the map_fault_timed fault with the ego_fault fault. Activate these faults in the Fault Table pane.
Simulate the model again. This image shows the injection status of ego_fault, map_fault_timed, and the fuel_mode signal.
You can only activate one fault on a model element at a time. Consequentially, you cannot simulate map_fault_timed and map_fault_conditional at the same time.
Simulate Faults with the Multiple Simulations Panel
You can simulate faults by manually activating them in the Fault Table pane, or automate combinations of faults by using the Multiple Simulations panel. For more information, see Configure and Run Simulations with Multiple Simulations Panel and Simulate Models with Faults by Using the Multiple Simulations Panel. To create the design study:
Open the Multiple Simulations panel. In the Fault Analyzer tab, in the Simulate section, click Multiple Simulations.
In the Multiple Simulations panel, create the design study. Click the Add a design study button
 .
.Click the Add a set of faults to the design study button
 .
.Select the faults. The design study prepares a list of simulations where each simulation enables one of the selected faults in the fault set. In this example, select all of the faults.
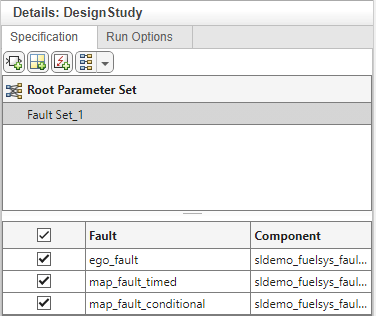
Save the design study. To run multiple simulations, in the Simulink® Toolstrip, in the Fault Analyzer tab, in the Simulate section, click Run > Run All. If you have Parallel Computing Toolbox™, you can also enable parallel simulation of the design study to improve simulation speeds. In the Multiple Simulations panel, in the Run Options tab, click Use Parallel.
You can review the study results using the Simulation Manager. At the bottom of the Simulink Editor, click Completed 3 simulations.
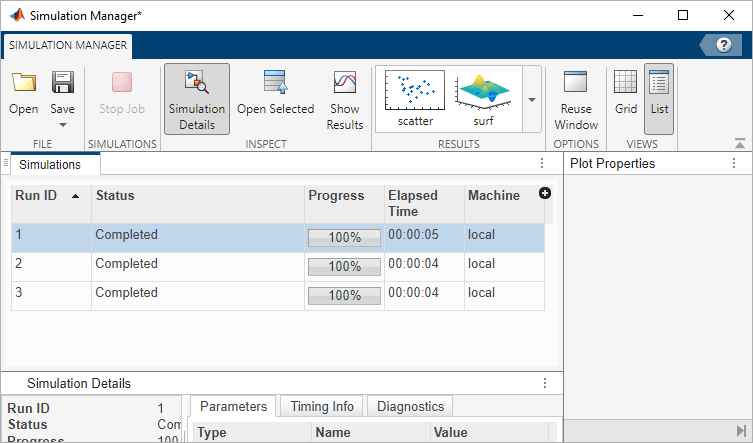
Select individual simulations and view their data in the Simulation Data Inspector. In the Simulations tab, select a simulation. In the toolstrip, in the Inspect section, click Show Results.
Link Faults and Model Elements to FMEA
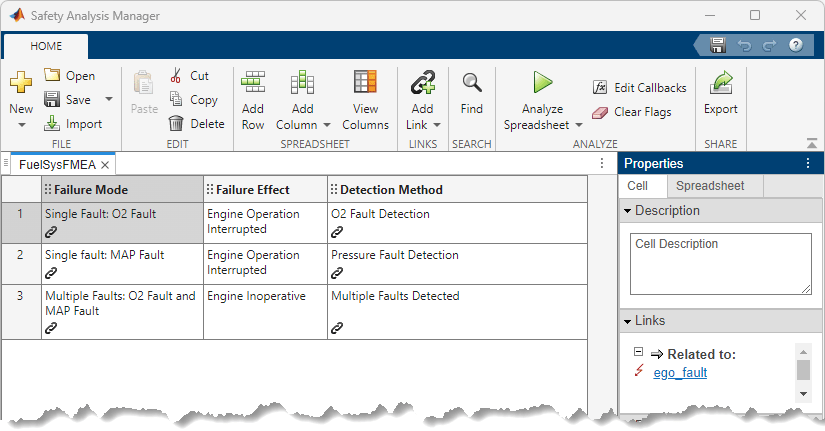
After you configure the simulations that you want to run, you can link Simulink Fault Analyzer™ artifacts to elements in safety analysis spreadsheets that you create in the Safety Analysis Manager. In this example, the faults are linked to cell entries in an FMEA spreadsheet. An FMEA is a common safety analysis that analyzes unintended system or component behaviors, known as failure modes, with respect to their potential effects on the system. This analysis often includes how effective mitigation logic, such as safety mechanisms, are at detecting abnormal behavior. Open the spreadsheet, FuelSysFMEA.mldatx, in the Safety Analysis Manager.
fuelSysFMEADoc = safetyAnalysisMgr.openDocument("FuelSysFMEA.mldatx");
safetyAnalysisMgr.openManager
Each entry in the Failure Mode column links to a fault, and each entry in the Detection Method column links to the associated detection logic in the model. Point to the link icon ![]() to view the links. You can also view the links by selecting the cell and, in the Properties pane, expanding the Links section.
to view the links. You can also view the links by selecting the cell and, in the Properties pane, expanding the Links section.
Run Callbacks to Simulate and Evaluate FMEA
To analyze the spreadsheet, you create and execute a callback. See Write Callbacks to Analyze Safety Analysis Manager Spreadsheets. In this example, the spreadsheet executes a callback when you click Analyze Spreadsheet. The callback runs the code in the custom MATLAB® function, validateFuelSysFMEAUsingSimulation. For each row of the spreadsheet with one or more linked faults in the Failure Mode column, the script activates those faults and simulates. The script then checks if the linked model artifact in the Detection Method column is active during simulation. If the fuel mode is not LOW at the end of the simulation, the script adds a check flag to the cell in the Detection Method column. To view and edit the callback script, open the function in MATLAB.
Click Analyze Spreadsheet to view the results. In this example, the detection method executes as designed for each simulation.
runAnalysis(fuelSysFMEADoc)
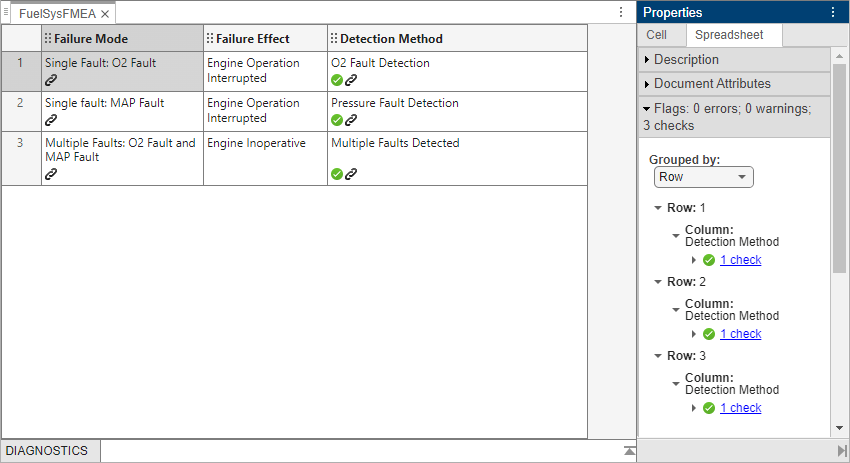
You can add different modes to test to the spreadsheet by adding a row and linking to different combinations of faults.
See Also
Topics
- Define and Model Faults
- Create Spreadsheets in the Safety Analysis Manager
- Fault Injection with Simulink Fault Analyzer
- Write Callbacks to Analyze Safety Analysis Manager Spreadsheets