使用布林森模型分析业绩归因
此示例演示了如何准备数据,创建 brinsonAttribution 对象,然后分析与类别(行业)权重和收益相关的业绩归因。在此示例中,您会使用到 categoryAttribution、categoryReturns、categoryWeights、totalAttribution 和 summary 函数进行分析。此外,您还可以使用 categoryReturnsChart、categoryWeightsChart 和 attributionsChart 为结果生成绘图。
准备数据
将股票价格数据加载到表格中。
T = readtable('dowPortfolio.xlsx');
MonthIdx = [1;20;39;62;81;103;125;145;168;188;210;231;251];
MonthlyPrices = T(MonthIdx,3:end);
使用 tick2ret 计算月收益。
MonthlyReturns = tick2ret(MonthlyPrices.Variables)';
[NumAssets,NumPeriods] = size(MonthlyReturns);
使用 categorical 定义资产类别(行业)。
Category = categorical(["Materials";"Financials";"Financials"; ...
    "Industrials";"Financials";"Industrials";"Materials"; ...
    "Communication Services";"Industrials";"Consumer Discretionary"; ...
    "Consumer Discretionary";"Industrials";"Information Technology"; ...
    "Information Technology";"Information Technology";"Health Care"; ...
    "Financials";"Consumer Staples";"Consumer Discretionary"; ...
    "Industrials";"Consumer Staples";"Health Care"; ...
    "Information Technology";"Health Care";"Consumer Staples"; ...
    "Communication Services";"Industrials";"Communication Services"; ...
    "Consumer Staples";"Energy"]);
Category = repmat(Category,1,NumPeriods);
定义基准与投资组合权重
按季度为每只股票资产定义基准权重和投资组合权重。
BenchmarkWeight = 1./length(MonthlyReturns).*ones(NumAssets, NumPeriods);

PortfolioWeightQ1 = [0;0;0.022;0.033;0;0.044;0.022;0.011;0.065;0.033; ...
    0.055;0.072;0;0.04;0;0.05;0.08;0.042;0.03;0.043;0.055;0.036;0.111; ...
    0.036;0;0.03;0;0.05;0;0.04]*ones(1,3);

PortfolioWeightQ2 = [0;0;0.022;0.033;0;0.044;0.022;0.011;0.049;0.033; ...
    0.055;0.074;0;0.04;0;0.05;0.08;0.042;0.03;0.02;0.055;0.036;0.148; ...
    0.036;0;0.03;0;0.05;0;0.04]*ones(1,3);

PortfolioWeightQ3 = [0;0;0.022;0.033;0;0.042;0.022;0.01;0.049;0.033; ...
    0.05;0.07;0;0.04;0;0.05;0.08;0.042;0.03;0.02;0.055;0.036;0.16; ...
    0.036;0;0.03;0;0.05;0;0.04]*ones(1,3);

PortfolioWeightQ4 = [0;0;0.022;0.033;0;0.042;0.02;0.01;0.039;0.033; ...
    0.05;0.07;0;0.04;0;0.05;0.08;0.042;0.03;0.02;0.055;0.036;0.198; ...
    0.036;0;0.03;0;0.03;0;0.034]*ones(1,3);

PortfolioWeight = [PortfolioWeightQ1 PortfolioWeightQ2 ...
    PortfolioWeightQ3 PortfolioWeightQ4];

Period = (1:NumPeriods).*ones(NumAssets,1);

Name = repmat(string(MonthlyPrices.Properties.VariableNames(:)),1,NumPeriods);
创建 AssetTable 输入。
使用 table 创建一个 AssetTable 输入以在创建 brinsonAttribution 对象时使用。
AssetTable = table(Period(:), Name(:), ...
MonthlyReturns(:), Category(:), ...
PortfolioWeight(:), BenchmarkWeight(:), ...
VariableNames=["Period", "Name","Return","Category",...
"PortfolioWeight","BenchmarkWeight"])
AssetTable=360×6 table
    Period     Name       Return              Category           PortfolioWeight    BenchmarkWeight
    ______    ______    ___________    ______________________    _______________    _______________

      1       "AA"         0.053621    Materials                          0            0.033333
      1       "AIG"        -0.05964    Financials                         0            0.033333
      1       "AXP"     -0.00019406    Financials                     0.022            0.033333
      1       "BA"        -0.030162    Industrials                    0.033            0.033333
      1       "C"         -0.055015    Financials                         0            0.033333
      1       "CAT"         0.17956    Industrials                    0.044            0.033333
      1       "DD"        -0.090708    Materials                      0.022            0.033333
      1       "DIS"        0.037221    Communication Services         0.011            0.033333
      1       "GE"         -0.07381    Industrials                    0.065            0.033333
      1       "GM"          0.27273    Consumer Discretionary         0.033            0.033333
      1       "HD"        -0.016838    Consumer Discretionary         0.055            0.033333
      1       "HON"        0.025457    Industrials                    0.072            0.033333
      1       "HPQ"        0.083598    Information Technology             0            0.033333
      1       "IBM"       -0.009235    Information Technology          0.04            0.033333
      1       "INTC"        -0.1685    Information Technology             0            0.033333
      1       "JNJ"       -0.066351    Health Care                     0.05            0.033333
      ⋮
创建 brinsonAttribution 对象
使用 brinsonAttribution 创建一个 brinsonAttribution 对象。
BrinsonPAobj = brinsonAttribution(AssetTable)
BrinsonPAobj =
  brinsonAttribution with properties:

                  NumAssets: 30
         NumPortfolioAssets: 22
         NumBenchmarkAssets: 30
                 NumPeriods: 12
              NumCategories: 9
                  AssetName: [30×1 string]
                AssetReturn: [30×12 double]
              AssetCategory: [30×12 categorical]
       PortfolioAssetWeight: [30×12 double]
       BenchmarkAssetWeight: [30×12 double]
    PortfolioCategoryReturn: [9×12 double]
    BenchmarkCategoryReturn: [9×12 double]
    PortfolioCategoryWeight: [9×12 double]
    BenchmarkCategoryWeight: [9×12 double]
            PortfolioReturn: 0.2234
            BenchmarkReturn: 0.2046
               ActiveReturn: 0.0188
计算类别权重
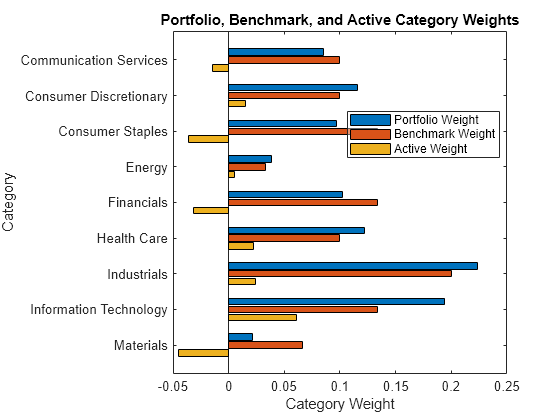
使用 brinsonAttribution 对象和 categoryWeights 计算投资组合和基准的平均及周期性类别权重,以及相应的主动权重。
[AverageCategoryWeights,PeriodicCategoryWeights] = categoryWeights(BrinsonPAobj)
AverageCategoryWeights=9×4 table
           Category           AveragePortfolioWeight    AverageBenchmarkWeight    AverageActiveWeight
    ______________________    ______________________    ______________________    ___________________

    Communication Services            0.0855                        0.1                  -0.0145
    Consumer Discretionary            0.1155                        0.1                   0.0155
    Consumer Staples                   0.097                    0.13333                -0.036333
    Energy                            0.0385                   0.033333                0.0051667
    Financials                         0.102                    0.13333                -0.031333
    Health Care                        0.122                        0.1                    0.022
    Industrials                      0.22375                        0.2                  0.02375
    Information Technology           0.19425                    0.13333                 0.060917
    Materials                         0.0215                   0.066667                -0.045167
PeriodicCategoryWeights=108×5 table
    Period           Category           PortfolioWeight    BenchmarkWeight    ActiveWeight
    ______    ______________________    _______________    _______________    ____________

      1       Communication Services         0.091                 0.1            -0.009
      1       Consumer Discretionary         0.118                 0.1             0.018
      1       Consumer Staples               0.097             0.13333         -0.036333
      1       Energy                          0.04            0.033333         0.0066667
      1       Financials                     0.102             0.13333         -0.031333
      1       Health Care                    0.122                 0.1             0.022
      1       Industrials                    0.257                 0.2             0.057
      1       Information Technology         0.151             0.13333          0.017667
      1       Materials                      0.022            0.066667         -0.044667
      2       Communication Services         0.091                 0.1            -0.009
      2       Consumer Discretionary         0.118                 0.1             0.018
      2       Consumer Staples               0.097             0.13333         -0.036333
      2       Energy                          0.04            0.033333         0.0066667
      2       Financials                     0.102             0.13333         -0.031333
      2       Health Care                    0.122                 0.1             0.022
      2       Industrials                    0.257                 0.2             0.057
      ⋮
计算类别收益
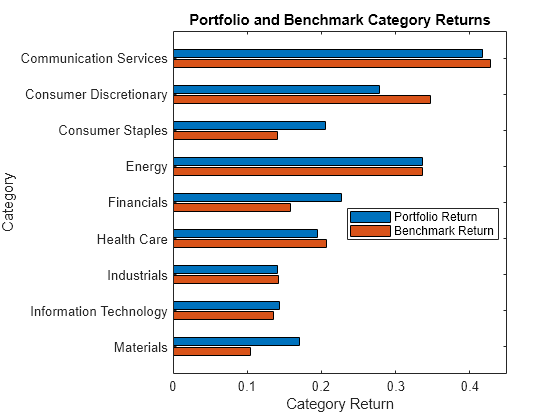
使用 brinsonAttribution 对象和 categoryReturns 计算投资组合和基准的聚合及周期性类别(行业)收益。
[AggregateCategoryReturns,PeriodicCategoryReturns] = categoryReturns(BrinsonPAobj)
AggregateCategoryReturns=9×3 table
           Category           AggregatePortfolioReturn    AggregateBenchmarkReturn
    ______________________    ________________________    ________________________

    Communication Services            0.41756                     0.42797
    Consumer Discretionary            0.27772                     0.34718
    Consumer Staples                  0.20572                     0.14112
    Energy                            0.33598                     0.33598
    Financials                        0.22678                     0.15838
    Health Care                       0.19451                     0.20679
    Industrials                       0.14132                     0.14253
    Information Technology            0.14339                     0.13485
    Materials                         0.17109                     0.10402
PeriodicCategoryReturns=108×4 table
    Period           Category           PortfolioReturn    BenchmarkReturn
    ______    ______________________    _______________    _______________

      1       Communication Services        0.056262           0.052385
      1       Consumer Discretionary        0.079767            0.10017
      1       Consumer Staples              -0.01485         -0.0033588
      1       Energy                        0.073093           0.073093
      1       Financials                  -0.0021179          -0.029374
      1       Health Care                   0.012124           0.022297
      1       Industrials                  0.0018686          0.0088589
      1       Information Technology        0.033481          -0.011315
      1       Materials                    -0.090708          -0.018543
      2       Communication Services        0.069253           0.078033
      2       Consumer Discretionary       -0.023091          -0.036416
      2       Consumer Staples             0.0027749         0.00096619
      2       Energy                         -0.0487            -0.0487
      2       Financials                    0.033379            0.02054
      2       Health Care                   0.014975           0.015929
      2       Industrials                   0.047732           0.041906
      ⋮
计算类别归因
使用 brinsonAttribution 对象和 categoryAttribution 计算投资组合在每个类别(行业)中的业绩归因。
[AggregateCategoryAttribution,PeriodicCategoryAttribution] = categoryAttribution(BrinsonPAobj)
AggregateCategoryAttribution=9×5 table
           Category           Allocation     Selection     Interaction    ActiveReturn
    ______________________    __________    ___________    ___________    ____________

    Communication Services    -0.0025318    -0.00071062      0.0002061     -0.0030363
    Consumer Discretionary     0.0024505       -0.00678     -0.0011609     -0.0054903
    Consumer Staples           0.0023692      0.0093618     -0.0025511        0.00918
    Energy                    0.00038824     1.3872e-19     2.7745e-20     0.00038824
    Financials                 0.0013464      0.0097268     -0.0022858      0.0087874
    Health Care               0.00011567     -0.0013031    -0.00028667     -0.0014741
    Industrials                0.0016701    -0.00035051    -5.7623e-05       0.001262
    Information Technology     0.0015686      0.0017812     0.00016898      0.0035187
    Materials                  0.0040725      0.0050687     -0.0034678      0.0056734
PeriodicCategoryAttribution=108×7 table
    Period    LinkingCoefficient           Category           Allocation      Selection     Interaction    ActiveReturn
    ______    __________________    ______________________    ___________    ___________    ___________    ____________

      1             1.1901          Communication Services    -0.00034021     0.00038766     -3.489e-05     1.2564e-05
      1             1.1901          Consumer Discretionary      0.0015405     -0.0020403    -0.00036725    -0.00086699
      1             1.1901          Consumer Staples           0.00065192     -0.0015322     0.00041752    -0.00046274
      1             1.1901          Energy                     0.00039006              0              0     0.00039006
      1             1.1901          Financials                  0.0013774      0.0036342    -0.00085403      0.0041575
      1             1.1901          Health Care                0.00016968     -0.0010173     -0.0002238     -0.0010714
      1             1.1901          Industrials               -0.00032634     -0.0013981    -0.00039845     -0.0021229
      1             1.1901          Information Technology    -0.00045756      0.0059728      0.0007914      0.0063066
      1             1.1901          Materials                   0.0014797      -0.004811      0.0032234    -0.00010793
      2             1.1935          Communication Services    -0.00058016      -0.000878      7.902e-05     -0.0013791
      2             1.1935          Consumer Discretionary    -0.00089975      0.0013325     0.00023985     0.00067261
      2             1.1935          Consumer Staples           0.00045794     0.00024116    -6.5715e-05     0.00063338
      2             1.1935          Energy                    -0.00041514              0              0    -0.00041514
      2             1.1935          Financials                -0.00021838      0.0017119     -0.0004023      0.0010912
      2             1.1935          Health Care                  5.19e-05    -9.5418e-05    -2.0992e-05     -6.451e-05
      2             1.1935          Industrials                 0.0016152      0.0011651     0.00033205      0.0031123
      ⋮
计算总归因
使用 brinsonAttribution 对象和 totalAttribution 计算投资组合在所有类别(行业)中汇总的总业绩归因。
[AggregateTotalAttribution,PeriodicTotalAttribution] = totalAttribution(BrinsonPAobj)
AggregateTotalAttribution=1×4 table
    Allocation    Selection    Interaction    ActiveReturn
    __________    _________    ___________    ____________

     0.011449     0.016794     -0.0094348       0.018809
PeriodicTotalAttribution=12×6 table
    Period    LinkingCoefficient    Allocation      Selection     Interaction    ActiveReturn
    ______    __________________    ___________    ___________    ___________    ____________

       1            1.1901            0.0044852    -0.00080413      0.0025538      0.0062349
       2            1.1935           0.00087285      0.0032617     -0.0025973      0.0015372
       3            1.1904          -6.9025e-05      0.0052394     0.00069386      0.0058643
       4             1.208            -0.004707     -0.0095748     -0.0046622      -0.018944
       5            1.1995          -0.00030704      -0.006091    -0.00061525     -0.0070132
       6            1.1935            0.0012025    -0.00026724     0.00058932      0.0015246
       7            1.1813            0.0032236       0.017541     -0.0021062       0.018658
       8             1.196             0.004629      -0.004929     -0.0018038     -0.0021038
       9            1.1927            0.0013046     0.00036681     0.00099195      0.0026634
      10            1.1923            0.0032172      0.0023077     -0.0023663      0.0031586
      11             1.194            -0.001881     0.00044958      0.0022018     0.00077039
      12            1.1918           -0.0022819      0.0069324     -0.0007375       0.003913
生成业绩归因汇总
使用 brinsonAttribution 对象和 summary 生成一个表格,该表格汇总使用布林森模型进行的业绩归因的最终结果(涵盖所有时间段和类别)。
SummaryTable = summary(BrinsonPAobj)
SummaryTable=11×1 table
                                     Brinson Attribution Summary
                                     ___________________________

    Total Number of Assets                           30
    Number of Assets in Portfolio                    22
    Number of Assets in Benchmark                    30
    Number of Periods                                12
    Number of Categories                              9
    Portfolio Return                            0.22345
    Benchmark Return                            0.20464
    Active Return                              0.018809
    Allocation Effect                          0.011449
    Selection Effect                           0.016794
    Interaction Effect                       -0.0094348
生成收益、权重和业绩归因的水平条形图
使用 brinsonAttribution 对象以及 categoryReturnsChart、categoryWeightsChart 和 attributionsChart 生成水平条形图。
categoryReturnsChart(BrinsonPAobj)
categoryWeightsChart(BrinsonPAobj)
attributionsChart(BrinsonPAobj, Style="stacked")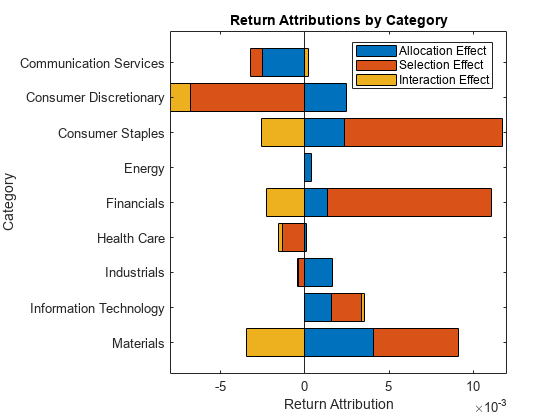
另请参阅
brinsonAttribution | categoryAttribution | categoryReturns | categoryWeights | totalAttribution | summary