coveragePlotter
R2026bCoverage plotter for theater plot
Description
A CoveragePlotter object defines a coverage plotter belonging to
a theaterPlot object. Use the
plotCoverage function to
plot sensor coverage areas using the CoveragePlotter object.
Creation
Description
cPlotter = coveragePlotter(tp)CoveragePlotter object for use with the theater plot object,
tp.
Input Arguments
Properties
Object Functions
plotCoverage | Plot set of beams and scan limits in theater coverage plotter |
clearData | Clear data from specific plotter of theater plot |
clearPlotterData | Clear plotter data from theater plot |
Examples
Create a theater plot and set the limits for its axes. Create a coverage plotter with DisplayName set to 'Sensor Coverage'.
tp = theaterPlot('XLim',[-40 40],'YLim',[-40 40],'ZLim',[-40 40]);
covp = coveragePlotter(tp,'DisplayName','Sensor Coverage');
Set up the configuration of the sensors whose coverage is to be plotted.
 sensor = struct('Index',1,'ScanLimits',[-45 45],'FieldOfView',[10;40],...
       'LookAngle',-10,'Range',30,'Position',zeros(1,3),'Orientation',zeros(1,3));
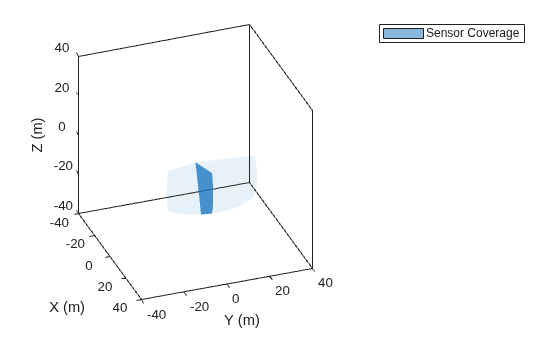
Plot the coverage using the plotCoverage function and visualize the results. The dark blue represents the current sensor beam, and the light blue represents the coverage area.
plotCoverage(covp,sensor)
view(70,30)
Create a theater plot and create a coverage plotter.
tp = theaterPlot('XLim',[-1e7 1e7],'YLim',[-1e7 1e7],'ZLim',[-2e6 1e6]);
covp = coveragePlotter(tp,'DisplayName','Sensor Coverage');
view(25,20)
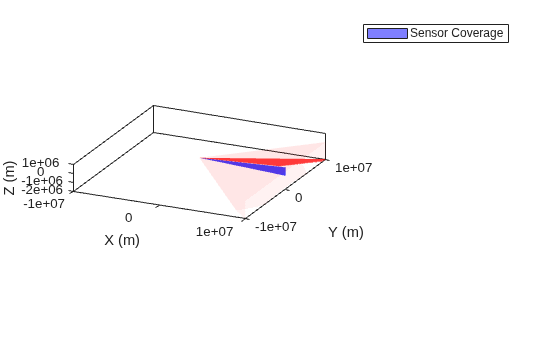
Model a non-scanning radar and a raster scanning radar.
radarIndex = 1;
radar =fusionRadarSensor(radarIndex,'No Scanning','RangeLimits',[0 1e8]);
RasterIndex = 2;
raster = fusionRadarSensor(RasterIndex,'Raster','RangeLimits',[0 1e8]);
Create a target platform.
tgt = struct( ...
        'PlatformID', 1, ...
        'Position', [0 -50e3 -1e3], ...
        'Speed', -1e3);
Simulate sensors and visualize their scanning pattern.
time = 0;
timestep = 1;
stopTime = 90;
while time < stopTime
    time = time+timestep;
    radar(tgt,time);
    raster(tgt,time);

    % Obtain sensor configuration using coverageConfig.
    radarcov = coverageConfig(radar);
    ircov = coverageConfig(raster);

    % Update plotter
    plotCoverage(covp,[radarcov,ircov],...
        [radarIndex, RasterIndex],...
        {'blue','red'}...
        );
    pause(0.03)
end
Version History
Introduced in R2020a

