orientationPlotter
R2026bOrientation plotter for theater plot
Description
An OrientationPlotter object defines an orientation plotter
belonging to a theaterPlot object. Use the
plotOrientation function to
plot orientations using the OrientationPlotter object.
Creation
Description
oPlotter = orientationPlotter(tp)OrientationPlotter object for use with the theater plot
tp.
oPlotter = orientationPlotter(tp,Name,Value)OrientationPlotter object with additional options specified by
one or more name-value arguments. Specify optional properties using
name-value arguments.
Input Arguments
Properties
Plot name to display in legend, specified as a character vector or string scalar. If you do not specify this property, no entry is shown in the legend.
Number of previous track updates to display, specified as a nonnegative integer less than or equal to 100. If set to 0, then no previous updates are rendered.
Marker symbol, specified as one of these symbols.
| Marker | Description | Resulting Marker |
|---|---|---|
"o" | Circle |
|
"+" | Plus sign |
|
"*" | Asterisk |
|
"." | Point |
|
"x" | Cross |
|
"_" | Horizontal line |
|
"|" | Vertical line |
|
"square" | Square |
|
"diamond" | Diamond |
|
"^" | Upward-pointing triangle |
|
"v" | Downward-pointing triangle |
|
">" | Right-pointing triangle |
|
"<" | Left-pointing triangle |
|
"pentagram" | Pentagram |
|
"hexagram" | Hexagram |
|
"none" | No markers | Not applicable |


Size of marker in points, specified as a positive integer.
Marker outline color, specified as a character vector, a string scalar, an RGB triplet, or a hexadecimal color code.
Marker fill color, specified as a character vector, a string scalar, an RGB
triplet, a hexadecimal color code, or 'none'.
Font size for labeling orientations, specified as a positive integer that represents font point size.
Gap between label and positional point it annotates, specified as a three-element row vector. Specify the [x y z] offset in meters.
Length of line used to denote each of the local x-, y-, and z-axes of the given orientation, specified as a positive scalar in meters.
Tag associated with the plotter, specified as a character vector or string scalar.
The default value is 'PlotterN', where
N is an integer that corresponds to the Nth
plotter associated with the theaterPlot. You can
use the findPlotter
function to identify plotters based on their tag.
Object Functions
plotOrientation | Plot set of orientations in orientation plotter |
clearData | Clear data from specific plotter of theater plot |
clearPlotterData | Clear plotter data from theater plot |
Examples
This example shows how to animate the orientation of an oscillating device.
Load rpy_9axis.mat. The data in rpy_9axis.mat is recorded accelerometer, gyroscope, and magnetometer sensor data from a device oscillating in pitch (around y-axis), then yaw (around z-axis), then roll (around x-axis). The device's x-axis was pointing southward when recorded.
ld = load('rpy_9axis.mat')ld = struct with fields:
Fs: 200
sensorData: [1×1 struct]
Set the sampling frequency. Extract the accelerometer and gyroscope data. Set the decimation factor to 2. Use fuse to create an indirect Kalman sensor fusion filter from the data.
accel = ld.sensorData.Acceleration;
gyro = ld.sensorData.AngularVelocity;
Fs  = ld.Fs;
decim = 2;
fuse = imufilter('SampleRate',Fs,'DecimationFactor',decim);
Obtain the pose information of the fused data.
pose = fuse(accel,gyro);
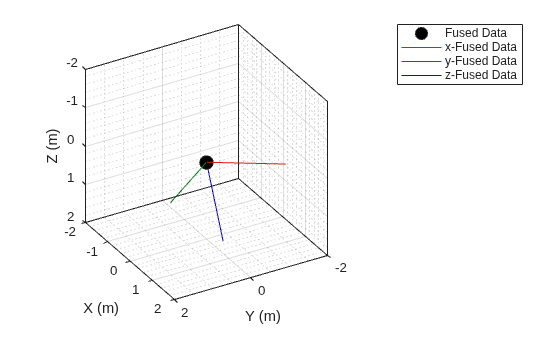
Create a theater plot. Add to the theater plot an orientation plotter with 'DisplayName' set to 'Fused Data' and 'LocalAxesLength' set to 2.
tp = theaterPlot('XLimit',[-2 2],'YLimit',[-2 2],'ZLimit',[-2 2]);
op = orientationPlotter(tp,'DisplayName','Fused Data',...
    'LocalAxesLength',2);
Loop through the pose information to animate the changing orientation.
for i=1:numel(pose)
    plotOrientation(op, pose(i))
    drawnow
end
Version History
Introduced in R2018b
See Also
theaterPlot | plotOrientation | clearData | clearPlotterData

