trajectoryPlotter
R2026bTrajectory plotter for theater plot
Description
A TrajectoryPlotter object defines a trajectory plotter belonging
to a theaterPlot object. Use the
plotTrajectory function to
plot trajectories using the TrajectoryPlotter object.
Creation
Description
trajPlotter = trajectoryPlotter(tp)TrajectoryPlotter object for use with the theater plot
tp.
trajPlotter = trajectoryPlotter(tp,Name,Value)TrajectoryPlotter object with additional options specified by
one or more name-value arguments. Specify optional properties using
name-value arguments.
Input Arguments
Properties
Object Functions
plotTrajectory | Plot set of trajectories in trajectory plotter |
clearData | Clear data from specific plotter of theater plot |
clearPlotterData | Clear plotter data from theater plot |
Examples
Define the coordinates for three trajectories.
coordinates1 = [(1:10)' (2:11)' (11:-1:2)'];
coordinates2 = coordinates1 + 1;
coordinates3 = coordinates1 + 2;
Create a theaterPlot object, set the view angles, and create a trajectoryPlotter object.
tp = theaterPlot;
view(14,50)
trajPlotter = trajectoryPlotter(tp,DisplayName="Trajectories");
Plot the three trajectories.
plotTrajectory(trajPlotter,{coordinates1,coordinates2,coordinates3})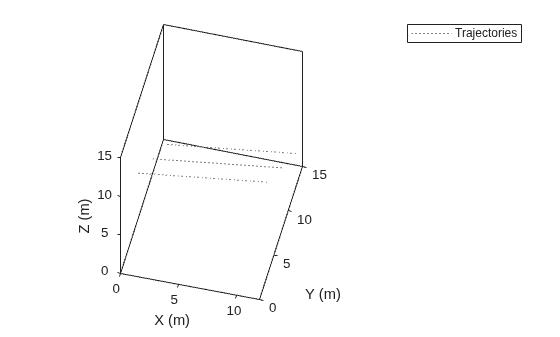
This example shows how to create an animation of a platform moving on a trajectory.
First, create a trackingScenario and add waypoints for a trajectory.
ts = trackingScenario;
height = 100;
d = 1;
wayPoints = [ ...
    -30   -25   height;
    -30    25-d height;
    -30+d  25   height;
    -10-d  25   height;
    -10    25-d height;
    -10   -25+d height;
    -10+d -25   height;
    10-d -25   height;
    10   -25+d height;
    10    25-d height;
    10+d  25   height;
    30-d  25   height;
    30    25-d height;
    30   -25+d height;
    30   -25   height];
Specify a time for each waypoint.
elapsedTime = linspace(0,10,size(wayPoints,1));
Next, create a platform in the tracking scenario and add trajectory information using the trajectory method.
target = platform(ts);
traj = waypointTrajectory('Waypoints',wayPoints,'TimeOfArrival',elapsedTime);
target.Trajectory = traj;
Record the tracking scenario to retrieve the platform's trajectory.
r = record(ts);
pposes = [r(:).Poses];
pposition = vertcat(pposes.Position);
Create a theater plot to display the recorded trajectory.
tp = theaterPlot('XLim',[-40 40],'YLim',[-40 40]);
trajPlotter = trajectoryPlotter(tp,'DisplayName','Trajectory');
plotTrajectory(trajPlotter,{pposition})
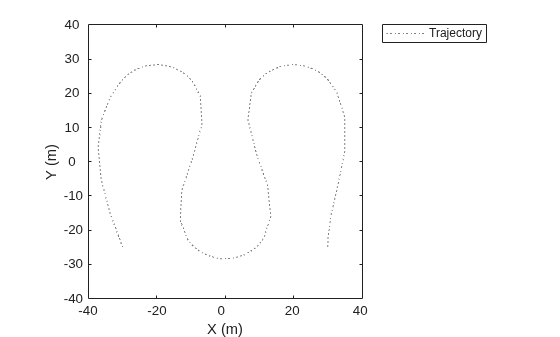
Animate using the platformPlotter.
restart(ts);
trajPlotter = platformPlotter(tp,'DisplayName','Platform');

while advance(ts)
    p = pose(target,'true');
    plotPlatform(trajPlotter, p.Position);
    pause(0.1)

end
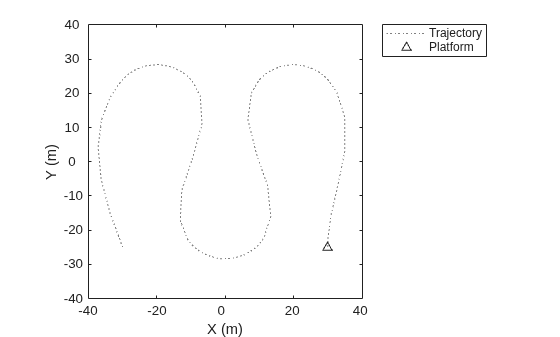
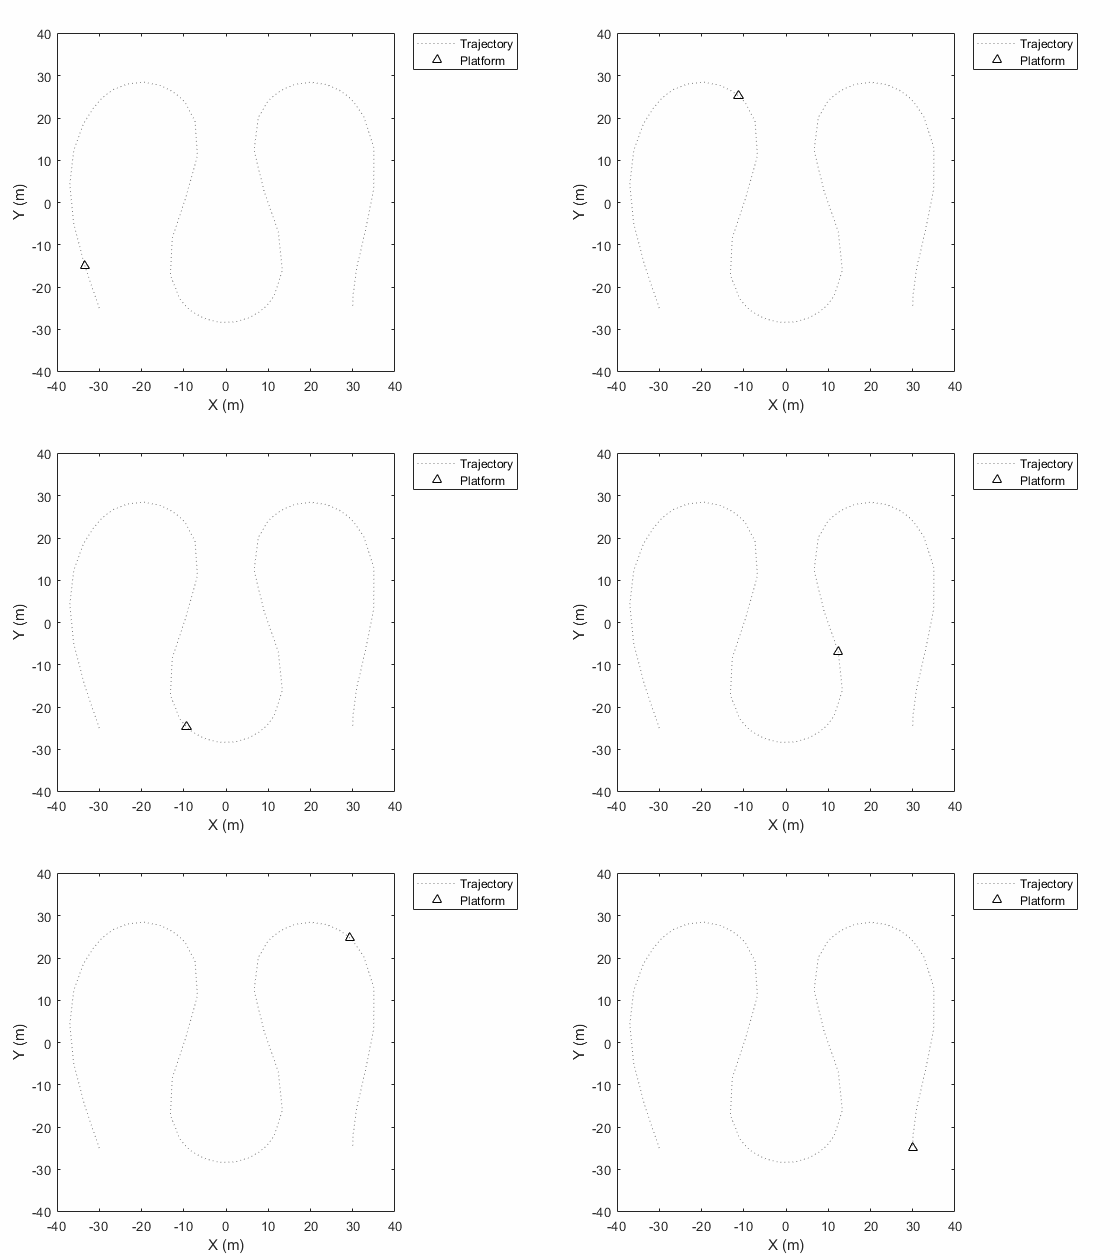
This animation loops through all the generated plots.
Version History
Introduced in R2018b

