使用 ga 进行全局优化与局部优化
寻找全局最小值
有时,优化的目标是找到函数的全局最小值或最大值-函数在搜索空间中的任何其他点都小于或大于该点。然而,优化算法有时会返回局部最小值-该点的函数值小于附近点,但可能大于搜索空间中远处点的函数值。遗传算法有时可以通过正确的设置来克服这一缺陷。
作为示例,考虑以下函数。
绘制函数。
t = -10:.1:103;
for ii = 1:length(t)
    y(ii) = two_min(t(ii));
end
plot(t,y)
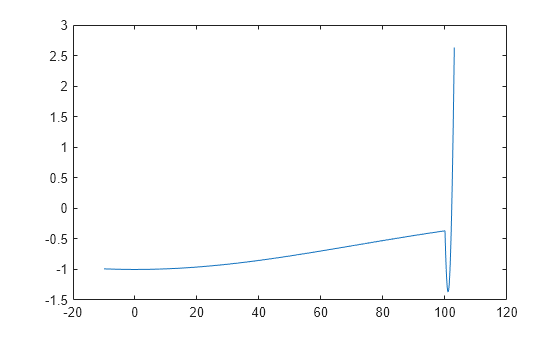
该函数有两个局部极小值,一个在 ,其中函数值为 -1,另一个在 ,其中函数值为 。由于后者的值较小,全局最小值出现在 处。
使用默认参数运行 ga
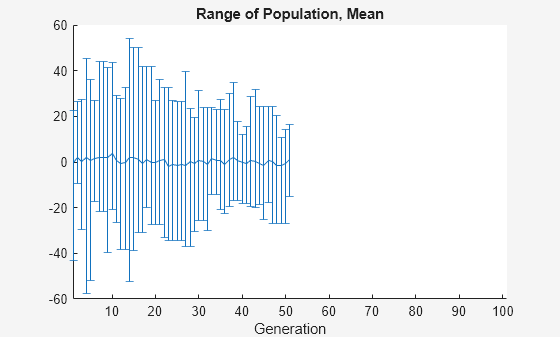
two_min 辅助函数的代码位于本示例的末尾。使用默认参数运行 ga 以最小化 two_min 函数。使用 gaplot1drange 辅助函数(包含在此示例的末尾)绘制每次迭代时 ga 种群的范围。
rng default % For reproducibility
options = optimoptions('ga','PlotFcn',@gaplot1drange);
[x,fval] = ga(@two_min,1,[],[],[],[],[],[],[],options)
ga stopped because the average change in the fitness value is less than options.FunctionTolerance.
x =
-0.0688
fval =
-1.0000
遗传算法返回一个非常接近 局部最小值的点。请注意,所有个体都位于 -60 至 60 之间。种群从未探索 处全局最小值附近的点。
增加初始范围
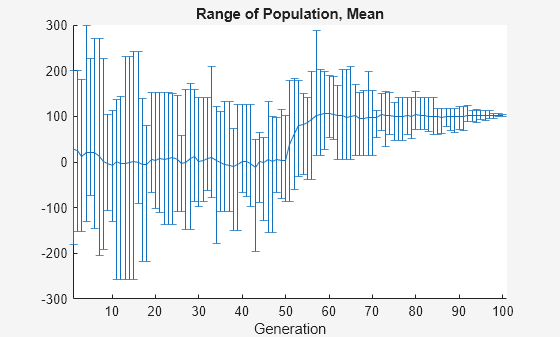
使遗传算法探索更大范围的点(即增加种群的多样性)的一种方法是增加初始范围。初始范围不必包含点 x = 101,但它必须足够大,以便算法在 x = 101 附近生成个体。将 InitialPopulationRange 选项设置为 [-10;90] 并重新运行求解器。
options.InitialPopulationRange = [-10;90];
[x,fval] = ga(@two_min,1,[],[],[],[],[],[],[],options)
ga stopped because it exceeded options.MaxGenerations.
x =
100.9783
fval =
-1.3674
这一次,自定义图表展现的个体范围更加广泛。从一开始就有接近 101 的个体,并且种群平均值开始收敛到 101。
辅助函数
以下代码创建 two_min 辅助函数。
function y = two_min(x)
if x <= 100
    y = -exp(-(x/100)^2);
else
    y = -exp(-1) + (x-100)*(x-102);
end
end
以下代码创建 gaplot1drange 辅助函数。
function state = gaplot1drange(options,state,flag)
%gaplot1drange Plots the mean and the range of the population.
%   STATE = gaplot1drange(OPTIONS,STATE,FLAG) plots the mean and the range
%   (highest and the lowest) of individuals (1-D only).
%
%   Example:
%   Create options that use gaplot1drange
%   as the plot function
%     options = optimoptions('ga','PlotFcn',@gaplot1drange);

%   Copyright 2012-2014 The MathWorks, Inc.

if isinf(options.MaxGenerations) || size(state.Population,2) > 1
    title('Plot Not Available','interp','none');
    return;
end
generation = state.Generation;
score = state.Population;
smean = mean(score);
Y = smean;
L = smean - min(score);
U = max(score) - smean;

switch flag

    case 'init'
        set(gca,'xlim',[1,options.MaxGenerations+1]);
        plotRange = errorbar(generation,Y,L,U);
        set(plotRange,'Tag','gaplot1drange');
        title('Range of Population, Mean','interp','none')
        xlabel('Generation','interp','none')
    case 'iter'
        plotRange = findobj(get(gca,'Children'),'Tag','gaplot1drange');
        newX = [get(plotRange,'Xdata') generation];
        newY = [get(plotRange,'Ydata') Y];
        newL = [get(plotRange,'Ldata') L];
        newU = [get(plotRange,'Udata') U];
        set(plotRange,'Xdata',newX,'Ydata',newY,'Ldata',newL,'Udata',newU);
end
end