Choose How to Measure Performance of Generated GPU Code
R2026bTo determine whether generated code uses the GPU effectively, measure the performance of the generated code. You can measure the execution time of generated code or profile generated code. When you profile generated code, GPU Coder™ measures timing information for kernel functions, memory transfers, and other generated code events and produces a GPU Performance Analyzer report.
The performance tool that you choose depends on your goal and whether you are generating a MEX function or standalone code. This table compares different ways to measure the performance of generated CUDA® code.
| Function | When to Use | Build Type | Notes |
|---|---|---|---|
gputimeit | You want to measure the execution time of a generated CUDA MEX function. |
| For MEX functions, use the |
gpuprofile | You want to profile generated CUDA MEX functions. |
|
|
codegen with the
-gpuprofile option | You want to generate a MEX function or software-in-the-loop (SIL) interface with profiling instrumentation. |
| To generate code trace information and performance diagnostics, use a SIL interface. |
gpuPerformanceAnalyzer |
|
|
|
Measure Execution Time of Generated MEX Functions by Using the
gputimeit Function
To measure the execution time of a generated MEX function, use the
gputimeit function. The function returns the execution time in
seconds. For example, suppose that you want to profile the
fog_rectification function from Generate GPU Code for Fog Rectification Algorithm. To load the function,
use the openExample command:
openExample("gpucoder/FogRectificationGPUExample")Load the input data directly on the GPU by creating gpuArray objects.
If you do not use gpuArray objects, the measurement that
gputimeit returns includes the time to copy input data to the GPU.
For example, this code loads an input matrix as a gpuArray type:
foggyImg = gpuArray(imread("foggyInput.png"));To generate a MEX function, create a MEX code configuration object by using the
coder.gpuConfig function.
cfg = coder.gpuConfig("mex");Generate code from the entry-point function.
codegen fog_rectification -config cfg -args {foggyImg};
Use gputimeit to measure the execution time of the generated MEX
function.
f = @() fog_rectification_mex(foggyImg);
gputimeit(f)
Profile Generated MEX Functions by Using the gpuprofile
Function
You can profile existing MEX functions by using the gpuprofile
function. The gpuprofile function times memory allocations, memory
deallocations, memory transfers, and kernel functions for MEX functions and opens the
results in the GPU Performance Analyzer. To profile a MEX function by using
gpuprofile, follow these steps:
Start GPU profiling.
gpuprofile onCall a generated CUDA MEX function in MATLAB. Run the generated MEX function twice so that the second run does not include overhead from initializing the MEX function.
fog_rectification_mex(foggyImg);
fog_rectification_mex(foggyImg);
Stop GPU profiling.
gpuprofile offView the performance data in the GPU Performance Analyzer.
gpuprofile viewer
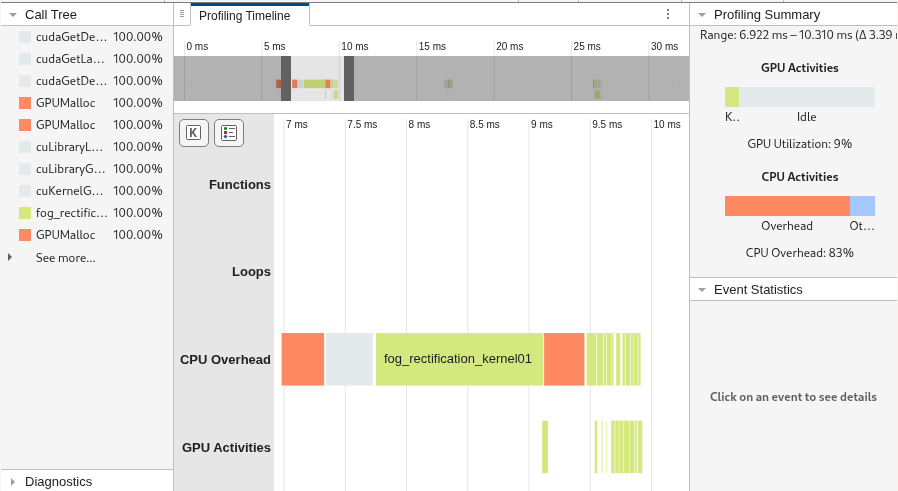
In this example, the Functions and Loops rows
are empty because the MEX function does not contain profiling instrumentation. To generate
code with profiling instrumentation, generate code by using the codegen
command with the -gpuprofile option.
Generate Code That Contains Profiling Instrumentation
To generate SIL executables or MEX functions that have profiling instrumentation, use
the codegen command with the -gpuprofile option.
When you run executables or functions that have profiling instrumentation, GPU Coder profiles additional events, such as CPU function calls and loops. The method
that you use to profile the code depends on the build type.
Generate MEX Function That Contains Profiling Instrumentation
For MEX build types, you can generate the MEX function with profiling instrumentation
and then profile it. When you profile a MEX function, GPU Coder also profiles function calls and loops in the generated code. For example,
use this code to generate a MEX function from fog_rectification that
contains profiling instrumentation.
cfg = coder.gpuConfig("mex");
codegen fog_rectification -config cfg -args {foggyImg} -gpuprofile;
Profile the generated code by using the gpuprofile function.
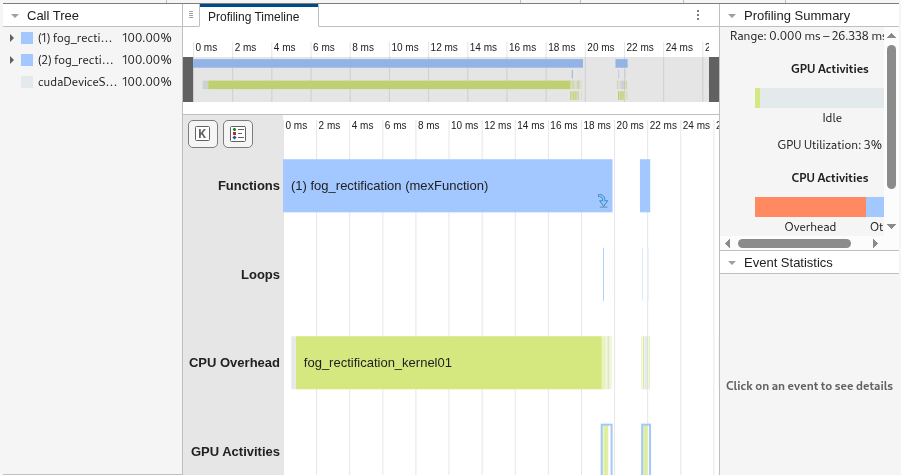
Because the MEX function has instrumentation, the Profiling Timeline
pane in the GPU Performance Analyzer displays events in the
Functions and Loops rows.
gpuprofile on
fog_rectification_mex(foggyImg);
fog_rectification_mex(foggyImg);
gpuprofile viewer
Generate SIL Executable That Contains Profiling Instrumentation
For static library and dynamic library build types, you can generate a SIL executable that contains profiling instrumentation. When you run the executable, GPU Coder captures performance data. After you end execution, the code generates a GPU Performance Analyzer report for calls to the executable.
For example, this code creates a code generation configuration for a dynamic library
and then generates a SIL executable for the fog_rectification
function:
cfg = coder.gpuConfig("dll");
codegen fog_rectification -args {foggyImg} -config cfg -gpuprofile
Execute the generated SIL interface. To capture profiling data from a run without one-time initialization costs, run the executable a second time.
fog_rectification_sil(foggyImg);
fog_rectification_sil(foggyImg);
Terminate the SIL execution. Click the link to the report to show the data from the
second call to fog_rectification_sil in the GPU Performance
Analyzer.
clear fog_rectification_sil### Application stopped
### Stopping SIL execution for 'fog_rectification'
### Starting profiling data processing
### Profiling data processing finished
Open GPU Performance Analyzer report: open('/home/gpucoder/simpleTest/codegen/dll/fog_rectification/html/gpuProfiler.mldatx')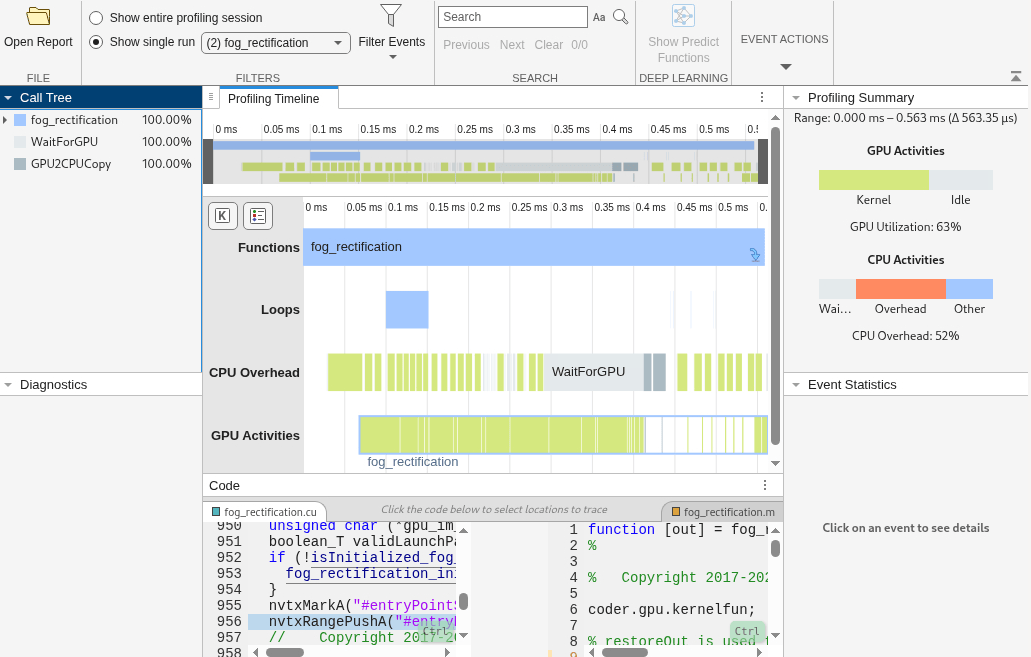
Generate and Profile Code by Using the gpuPerformanceAnalyzer
Function
To generate and profile code in one function call, or to profile code on the host
machine or an NVIDIA
Jetson hardware board, use the gpuPerformanceAnalyzer function.
The gpuPerformanceAnalyzer function generates code, runs the code a
fixed number of times, and opens the profiling report in the GPU Performance
Analyzer.
Generate and Profile Code on the Host Machine
To profile code on the host machine, create a code generation configuration for a MEX
function, static library, or dynamic library, and call the
gpuPerformanceAnalyzer function. For example, this code creates a
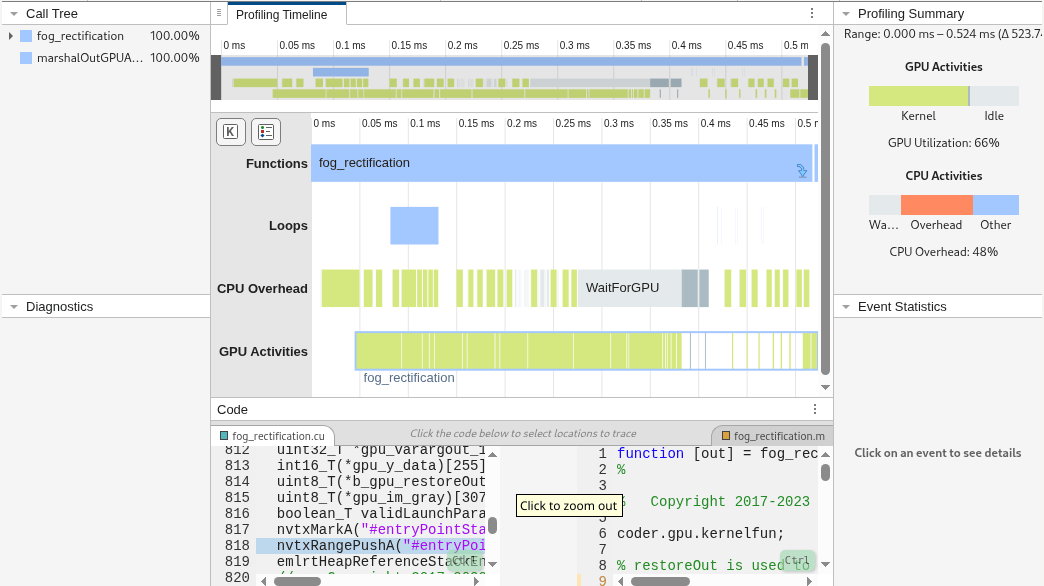
code generation configuration for a MEX function and profiles the generated code. By
default, the gpuPerformanceAnalyzer function runs the generated code
twice and then shows the profiling data in the GPU Performance
Analyzer.
cfg = coder.gpuConfig("mex");
gpuPerformanceAnalyzer("fog_rectification",{foggyImg},Config=cfg)
Generate and Profile Code on NVIDIA Jetson
To profile code on NVIDIA Jetson, create a code generation configuration for a static or dynamic library.
cfg = coder.gpuConfig("dll");Create a hardware board configuration for NVIDIA Jetson.
cfg.Hardware = coder.hardware("NVIDIA Jetson");Generate code and run it on NVIDIA
Jetson by using the gpuPerformanceAnalyzer function with the
code generation configuration. The functions generates code, deploys the code to the
Jetson board, and profiles the code execution.
gpuPerformanceAnalyzer("fog_rectification",{foggyImg},Config=cfg)For more information about GPU profiling on NVIDIA Jetson, see GPU Profiling on NVIDIA Jetson Platforms.

