GPU Profiling on NVIDIA Jetson Platforms
This example shows how to do GPU profiling of generated CUDA® code on the Jetson™ platform by using the gpuPerformanceAnalyzer function.
The gpuPerformanceAnalyzer function generates code, executes it, and collect metrics on the CPU and GPU activities in the generated code. The function generates a report that contains a chronological timeline plot you can use to visualize, identify, and mitigate performance bottlenecks in the generated CUDA code.
This example generates the performance analyzer report for a feature matching algorithm. For more information, see Generate GPU Code for Feature Matching Algorithm.
Prerequisites
Target Board Requirements
NVIDIA® Jetson™ embedded platform.
NVIDIA CUDA toolkit installed on the target board.
Environment variables on the target board for the compilers and libraries. For information on the supported versions of the compilers and libraries and their setup, see Prerequisites for Generating Code for NVIDIA Boards for NVIDIA boards.
Permissions to access GPU performance counters. From CUDA toolkit v10.1, NVIDIA restricts access to performance counters to only admin users. To enable GPU performance counters to for all users, see the instructions provided in Permission issue with Performance Counters (NVIDIA).
Ethernet crossover cable to connect the target board and host PC. If you can connect the target board to a local network, a cable is not required.
Development Host Requirements
NVIDIA CUDA toolkit and driver.
Environment variables on the development host for the compilers and libraries. For information on the supported versions of the compilers and libraries, see Third-Party Hardware. For setting up the environment variables, see Setting Up the Prerequisite Products.
Verify NVIDIA Support Package Installation on Host
Use the checkHardwareSupportPackageInstall function to verify that the host system has the necessary support packages to run this example.
checkHardwareSupportPackageInstall();
Connect to the NVIDIA Hardware
The MATLAB Coder™ Support Package for NVIDIA Jetson and NVIDIA DRIVE® Platforms uses an SSH connection over TCP/IP to execute commands while building and running the generated CUDA code on the Jetson platform. You must connect the target platform to the same network as the host computer or use an Ethernet crossover cable to connect the board directly to the host computer. Refer to the NVIDIA documentation on how to set up and configure your board.
To communicate with the NVIDIA hardware, you must create a live hardware connection object by using the jetson function. You must know the host name or IP address, username, and password of the target board to create a live hardware connection object. For example, when connecting to the target board for the first time, create a jetson object by using the command:
hwobj= jetson("host-name","username","password");
The jetson object reuses the settings from the most recent successful connection to the Jetson hardware. This example establishes an SSH connection to the Jetson hardware using the settings stored in memory.
hwobj = jetson;
### Checking for CUDA availability on the target...
### Checking for 'nvcc' in the target system path...
### Checking for cuDNN library availability on the target...
### Checking for TensorRT library availability on the target...
### Checking for prerequisite libraries is complete.
### Gathering hardware details...
### Checking for third-party library availability on the target...
### Gathering hardware details is complete.
Board name              : NVIDIA Jetson Orin Nano Developer Kit
CUDA Version            : 12.2
cuDNN Version           : 8.9
TensorRT Version        : 8.6
GStreamer Version       : 1.20.3
V4L2 Version            : 1.22.1-2build1
SDL Version             : 1.2
OpenCV Version          : 4.8.0
Available Webcams       :
Available GPUs          : Orin
Available Digital Pins  : 7  11  12  13  15  16  18  19  21  22  23  24  26  29  31  32  33  35  36  37  38  40
In case of a connection failure, a diagnostics error message appears on the MATLAB® command line. If the connection fails, the most likely cause is an incorrect IP address or hostname.
By default, when there are multiple jetson connection objects for different targets, the code generator uses the most recent jetson object for remote builds. To choose a hardware board for the remote build, use the setupCodegenContext() method of the respective live hardware object. If only one jetson connection object was created, it is not necessary to call this method.
setupCodegenContext(hwobj);
Verify GPU Environment on the Target
To verify that the compilers and libraries necessary for this example are set up correctly, use the coder.checkGpuInstall function.
envCfg = coder.gpuEnvConfig('jetson');
envCfg.DeepLibTarget = 'cudnn';
envCfg.DeepCodegen = 1;
envCfg.Quiet = 1;
envCfg.HardwareObject = hwobj;
coder.checkGpuInstall(envCfg);
When the Quiet property of the coder.gpuEnvConfig object is set to true, the coder.checkGpuInstall function returns only warning or error messages.
Detect and Extract Features from Images
For this example, you perform feature matching on two images that are rotated and scaled with respect to each other. Before you can match the two images, you must detect and extract feature points for each image. The featureDetectionAndExtraction helper function uses the SURF detectSURFFeatures (Computer Vision Toolbox) function to detect the feature points and extractFeatures (Computer Vision Toolbox) to extract the features.
type featureDetectionAndExtraction.mfunction [refPoints,refDesc,qryPoints,qryDesc] = featureDetectionAndExtraction(refImage,qryImage) % Copyright 2018-2021 The MathWorks, Inc. %% Extract features from both the images and find matching points % SURF Feature Detection refPointsStruct = detectSURFFeatures(refImage, 'MetricThreshold', 300); qryPointsStruct = detectSURFFeatures(qryImage, 'MetricThreshold', 300); % SURF Feature Extraction refDesc = extractFeatures(refImage, refPointsStruct, 'FeatureSize', 128); qryDesc = extractFeatures(qryImage, qryPointsStruct, 'FeatureSize', 128); % Extract coordinate locations from SURFPoints structure refPoints = refPointsStruct.Location; % Extract coordinate locations from SURFPoints structure qryPoints = qryPointsStruct.Location;
The function featureDetectionAndExtraction returns:
refPoints— The reference image feature coordinates.qryPoints— The query image feature coordinates.refDescFeat— The reference image feature descriptors.qryDescFeat— The query image feature descriptors.
In this example, the image in camerman.tif is the reference image. Rotate and scale the reference image to create a new image. Detect and extract features from both images with featureDetectionAndExtraction.
K = imread('cameraman.tif');
refImage = imresize(K,3);
scale = 0.7;
J = imresize(refImage,scale);
theta = 30.0;
qryImage = imrotate(J,theta);
[refPoints,refDescFeat,qryPoints,qryDescFeat] = featureDetectionAndExtraction(refImage,...
    qryImage);
Examine the feature_matching Entry-Point Function
The feature_matching function takes the feature points and feature descriptors extracted from two images by featureDetectionAndExtraction and finds a match between them.
type feature_matchingfunction [matchedRefPoints,matchedQryPoints] = feature_matching(refPoints,...
refDesc,qryPoints,qryDesc)
%#codegen
% Copyright 2018-2021 The MathWorks, Inc.
coder.gpu.kernelfun;
%% Feature Matching
[indexPairs,matchMetric] = matchFeatures(refDesc, qryDesc);
matchedRefPoints = refPoints(indexPairs(:,1),:);
matchedQryPoints = qryPoints(indexPairs(:,2),:);
Generate GPU Performance Analyzer Report
To analyze the performance of the generated code, use the gpuPerformanceAnalyzer function. First, create a code configuration object with a dynamic library build type by using the dll input argument. Enable the option to create a coder.EmbeddedCodeConfig configuration object.
cfg = coder.gpuConfig('dll','ecoder',true);
To use gpuPerformanceAnalyzer for the Jetson target, set the Hardware property of the code configuration object to the appropriate target platform. You can also use GPU performance analyzer to profile deep learning applications and embedded applications targeting NVIDIA DRIVE® platforms.
cfg.Hardware = coder.Hardware('NVIDIA Jetson');Run gpuPerformanceAnalyzer with the default iteration count of 2. The GPU Performance Analyzer collects performance data for both iterations and the entire profiling session. The GPU Performance Analyzer results open automatically.
inputs = {refPoints,refDescFeat,qryPoints,qryDescFeat};
designFileName = 'feature_matching';

gpuPerformanceAnalyzer(designFileName, inputs, ...
    'Config', cfg, 'NumIterations', 2);
### Checking for CUDA availability on the target...
### Checking for 'nvcc' in the target system path...
### Starting GPU code generation
### Connectivity configuration for function 'feature_matching': 'NVIDIA Jetson'
PIL execution is using Port 17725.
PIL execution is using 30 Sec(s) for receive time-out.
Code generation successful: View report
### GPU code generation finished
### Starting application profiling
### Starting application: 'codegen\dll\feature_matching\pil\feature_matching.elf'
To terminate execution: clear feature_matching_pil
### Launching application feature_matching.elf...
PIL execution terminated on target.
### Application profiling finished
### Starting profiling data processing
### Profiling data processing finished
### Showing profiling data
Examine Results in the GPU Performance Analyzer
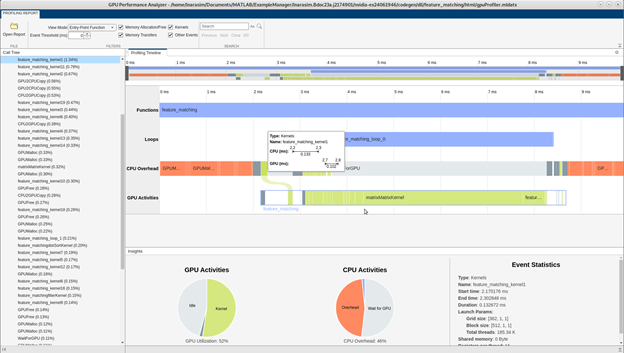
The GPU Performance Analyzer window lists GPU and CPU activities, events, and performance metrics in a chronological timeline plot that you can use to visualize, identify, and address performance bottlenecks in the generated CUDA code.
These numbers are representative. The actual values depend on your hardware setup. The profiling in this example was performed using MATLAB® R2025a on a Jetson Orin Nano board.
Profiling Timeline
The Profiling Timeline pane shows the complete trace of all events that have a runtime higher than the threshold value. This image shows a snippet of the profiling trace when the threshold value is set to 0.0 ms.
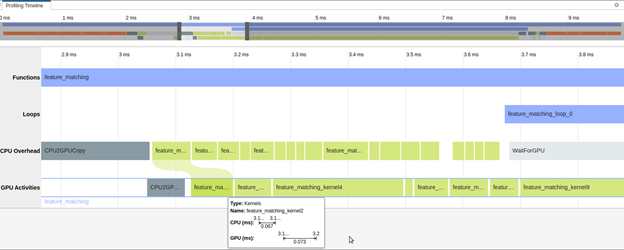
You can use the mouse wheel or the equivalent touchpad option to control the zoom level of the timeline. Alternatively, you can use the timeline summary at the top of the panel to control the zoom level and navigate the timeline plot.
The tooltips on each event indicate the start time, end time, and duration of the selected event on the CPU and the GPU. The tooltips also indicate the time elapsed between the kernel launch on the CPU and the actual execution of the kernel on the GPU.

To learn more about an event, select it in the timeline. In the toolstrip, use the buttons in the Event Actions section to trace the generated code, view related events, or view parent and children events.
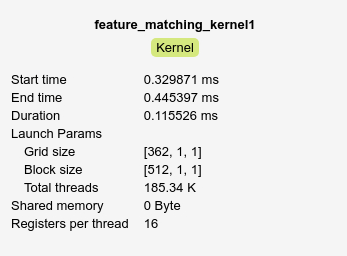
Event Statistics
The Event Statistics pane shows additional information for the selected event. For example, selecting the feature_matching_kernel2 shows the start time, end time, duration, launch parameters, shared memory, and registers per thread for the kernel.
Profiling Summary
The Profiling Summary pane includes bar charts that provide an overview of the GPU and CPU activities. The bar charts change according to the zoom level of the profiling timeline. This image shows a snippet of the profiling summary.
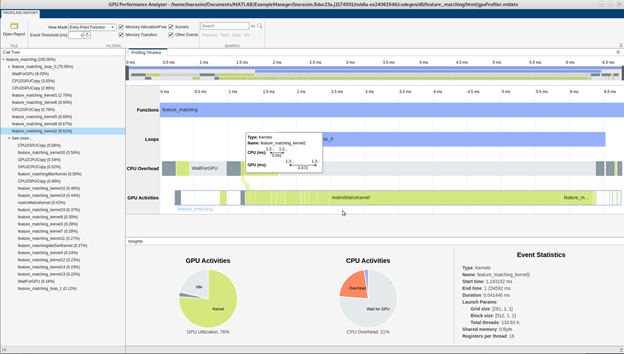
Call Tree
This section lists the GPU events called from the CPU. Each event in the call tree lists the execution times as percentages of the caller function. This metric can help you to identify performance bottlenecks in the generated code. You can also navigate to specific events on the profiling timeline by clicking on the corresponding events in the call tree.
Filters
This section provides filtering options for the report. Select Show entire profiling session to view profiling results for the entire application, including initialize and terminate. Alternatively, select Show single run to view results from an individual run of the design function.
Under Filter Events, you can specify:
Event Threshold — Skip events shorter than the given threshold.
Memory Allocation/Free — Show GPU device memory allocation and deallocation related events on the CPU activities bar.
Memory Transfers — Show host-to-device and device-to-host memory transfers.
Kernel — Show CPU kernel launches and GPU kernel activities.
Other Event — Show other GPU related events such as synchronization and waiting for GPU.