Change Detection in Hyperspectral Images
This example shows how to detect changes in land cover from hyperspectral images taken at different times.
Change detection (CD) is the process of determining the changes in land cover based on multiple observations at different times. Information regarding land cover changes is important for effective analysis of the ecological environment, natural resources, and social development of a region.
In this example, you perform these steps:
Read and visualize hyperspectral images acquired at different times.
Estimate the change between the images.
Compare the detected change with the ground truth.
Display the detected changes.
This example requires the Hyperspectral Imaging Library for Image Processing Toolbox™. You can install the Hyperspectral Imaging Library for Image Processing Toolbox from Add-On Explorer. For more information about installing add-ons, see Get and Manage Add-Ons. The Hyperspectral Imaging Library for Image Processing Toolbox requires desktop MATLAB®, as MATLAB Online™ and MATLAB Mobile™ do not support the library.
Load and Visualize Hyperspectral Images
This example uses the Bay Area data set [1], collected in the years 2013 and 2015 with the AVIRIS sensor, surrounding the city of Patterson, California. The spatial dimensions of the data set are 600-by-500 pixels, and it includes 224 spectral bands with a spatial resolution of approximately 30 meters per pixel.
Download the data set and unzip the file by using the downloadChangeDetectionData helper function. The helper function is attached to this example as a supporting file.
zipfile = "bayArea_dataset.zip";
data_url = "https://ssd.mathworks.com/supportfiles/image/data/" + zipfile;
downloadChangeDetectionData(data_url,pwd)
Downloading the change detection dataset.
This can take several minutes to download...
Done.
Load the data set into the workspace. The variables T1 and T2 are the datacubes of the two hyperspectral images. The MAT file also contains a ground truth change map for the same region, groundTruth.
load bayArea_dataset.matDisplay the RGB bands of both hyperspectral images. The images are AVIRIS images, for which band numbers 26, 16, and 8 are the R, G, and B wavelengths, respectively.
image1 = imadjustn(rescale(T1(:,:,[26 16 8])));
image2 = imadjustn(rescale(T2(:,:,[26 16 8])));
figure
montage({image1 image2},Size=[1 2],BorderSize=5)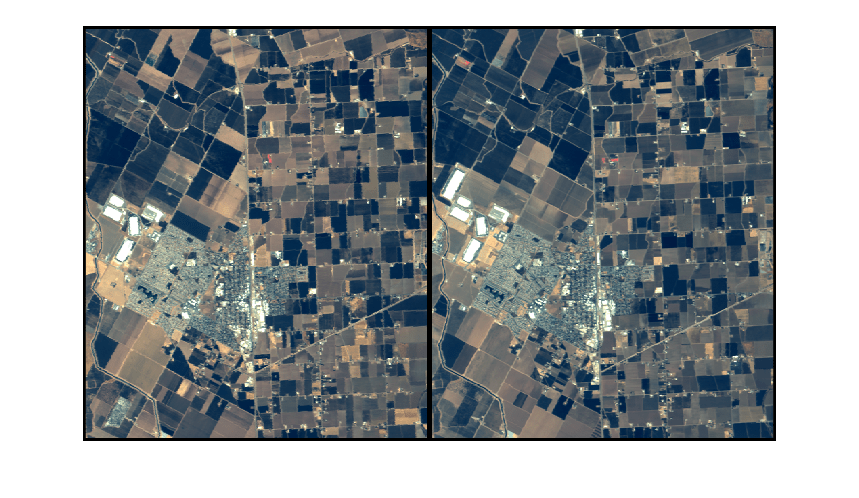
Detect Changes Between Hyperspectral Images
Specify the window size value for change detection. A larger window size enables you to handle larger misalignment errors between the two images.
windowSize = 7;
Estimate the changes between the two images. Assuming that both hyperspectral images are perfectly aligned, which means that both images have the spectral signature of the same physical area at each corresponding pixel location, you can assess the dissimilarity between corresponding pixels in the two images by measuring the distance between the spectral signatures.
change = changeDetection(T1,T2,windowSize);
Compare with Ground Truth
Convert the estimated change map change to a binary image using a threshold.
threshold = 0.07;
changeMap = mat2gray(change);
bw = changeMap > threshold;
Convert the ground truth change map groundTruth to a binary image. The threshold for the ground truth is 0 because groundTruth has a data type of uint8 instead of double.
bwGroundTruth = groundTruth > 0;
Compare the estimated binary change map to the ground truth binary change map.
figure
montage({bwGroundTruth bw},Size=[1 2],BorderSize=5)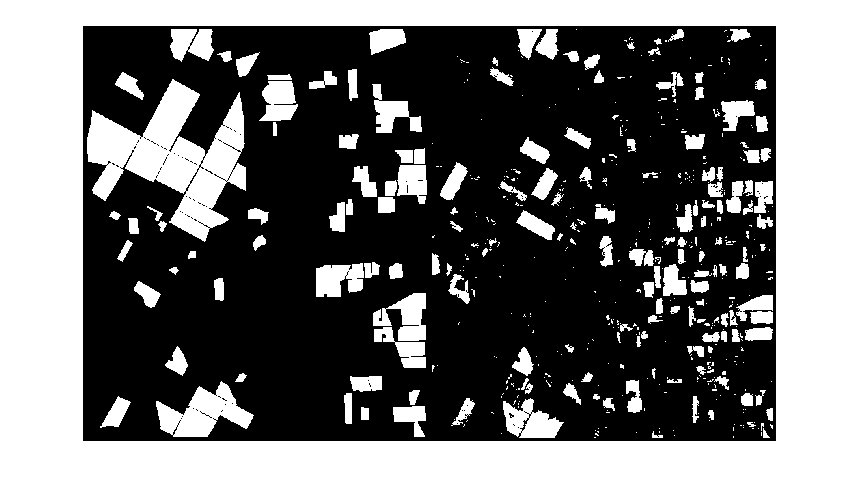
Compute the similarity between the estimated and ground truth binary change maps.
similarity = bfscore(bw,bwGroundTruth)
similarity =
0.6039
Display Detected Changes
Visualize the detected changes between the images as an overlay on the second hyperspectral image.
labelOut = labeloverlay(image2,bw,Colormap="autumn",Transparency=0.5);
figure
imshow(labelOut)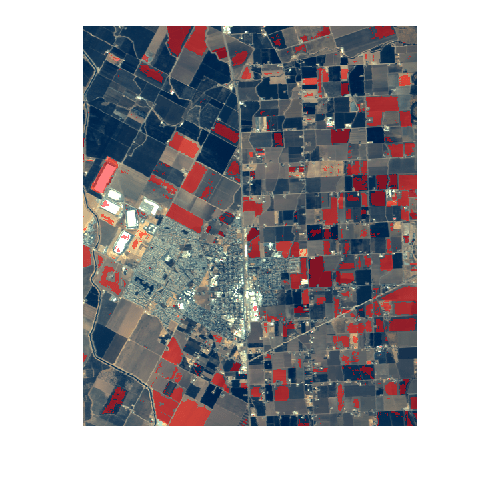
Supporting Functions
The changeDetection helper function estimates the changes between two images captured at different times. Because the time of image acquisition is not known, the helper function uses the symmetric local coregistration adjustment (SLCRA) algorithm, which evaluates the dissimilarity in both directions and fuses the dissimilarity measurement.
function changeMap = changeDetection(imageData1,imageData2,windowSize)
    % Get the center of window.
    centerPixel = ((windowSize-1)/2);

    % Get the size of the input data.
    [row,col,~] = size(imageData1);

    if isinteger(imageData1)
        imageData1 = single(imageData1);
        imageData2 = single(imageData2);
    end

    % Apply zero padding to handle the edge pixels.
    imageData1 = padarray(imageData1,[centerPixel centerPixel],0,"both");
    imageData2 = padarray(imageData2,[centerPixel centerPixel],0,"both");

    % Initialize the change map output.
    changeMap = zeros(row,col);

    for r = (centerPixel + 1):(row + centerPixel)
        for c = (centerPixel + 1):(col + centerPixel)
            rowNeighborhood = (r - centerPixel):(r + centerPixel);
            colNeighborhood = (c - centerPixel):(c + centerPixel);
            % Find the Euclidean distance between the reference signature and
            % the neighborhood of the target signature.
            spectra1 = reshape(imageData1(r,c,:),1,[]);
            spectra2 = reshape(imageData2(rowNeighborhood,colNeighborhood,:), ...
                windowSize*windowSize,size(imageData1,3));
            a = min(pdist2(spectra1,spectra2));
            % Find the Euclidean distance between the target signature and
            % the neighborhood of the reference signature.
            spectra1 = reshape(imageData2(r,c,:),1,[]);
            spectra2 = reshape(imageData1(rowNeighborhood,colNeighborhood,:), ...
                windowSize*windowSize,size(imageData1,3));
            b = min(pdist2(spectra1, spectra2));
            % Store the pixel-wise results in the change map.
            changeMap(r - centerPixel,c - centerPixel) = max(a,b);
        end
    end
end
References
[1] Heras, Dora Blanco, Álvaro Ordóñez Iglesias, Jorge Alberto Suárez Garea, Francisco Argüello Pedreira, Javier López Fandiño, and Pablo Quesada Barriuso. Hyperspectral Change Detection Dataset. October 5, 2016. Distributed by Centro Singular de Investigación en Tecnoloxías Intelixentes. https://citius.usc.es/investigacion/datasets/hyperspectral-change-detection-dataset.