Display and Explore Blocked Images
This example shows how to visualize and explore large and multiresolution images stored as blockedImage objects.
In this example, you display a blocked image by using imageshow (since R2024b), which is recommended over bigimageshow for basic display and exploration of large images because it provides faster performance and smoother zoom and pan interactions. Before R2024b, or for advanced display tasks that customize properties of MATLAB® Graphics Objects, such as creating a tiledlayout or adding ROI annotation objects like images.roi.Polygon, use bigimageshow.
Load Blocked Image
Create a blocked image using a modified version of image tumor_091.tif from the CAMELYON16 data set. The image shows a lymph node containing tumor tissue. The original image has eight resolution levels, and the finest level has resolution 53760-by-61440. The modified image has only three resolution levels. The spatial referencing of the modified image has been adjusted to enforce a consistent aspect ratio and to register features at each level.
bim = blockedImage("tumor_091R.tif");
disp(bim.NumLevels)
3
disp(bim.Size)
        5000        5358           3
        1250        1340           3
         625         670           3
Explore Image
For basic display and exploration use cases, you can display the blocked image using imageshow. The function displays the blocked image data at the best resolution size based on the size of the viewer and the available screen size.
imageshow(bim);
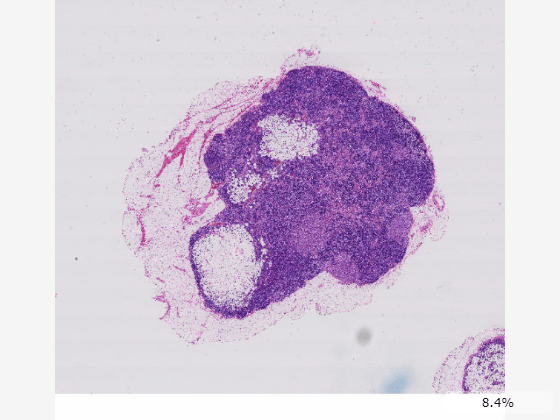
Zoom in the image using the mouse scroll wheel, and pan by dragging inside the viewer window. As you zoom in, the resolution level automatically adjusts to a finer resolution based on the current field of view and screen size. The bottom-left corner of the viewer displays a zoomed-in preview, coordinates, and color or intensity values for the pixel under the mouse cursor. You can hide the pixel information display from the viewer context menu. Right-click in the display window to open the context menu.

Display Blocked Image in World Coordinates
If your application requires measuring coordinates or distances in world units, you can define custom world coordinates by specifying the WorldStart and WorldEnd properties of the blockedImage object.
Specify the pixel size, in millimeters, in the finest resolution level. For this image, the pixel size is approximately 0.22 micrometers, which is typical for 100x microscopy objectives. This information is available from the raw data on the Camelyon 17 Grand Challenge website.
pixelSpacing = 0.000226316;
Specify the position of the upper-left edge of the first pixel, assuming (0, 0) for all three resolution levels.
worldStart = zeros(bim.NumLevels,bim.NumDimensions);
Calculate the position of the lower-right edge of the last pixel of the finest resolution level. The location is the product of the number of pixels and the pixel size, in millimeters. Expand the worldEnd value using repmat to specify the same position for all three resolution levels.
worldEnd = bim.Size(1,:)*pixelSpacing;
worldEnd = repmat(worldEnd,[bim.NumLevels,1]);
Update the WorldStart and WorldEnd property values.
bim.WorldStart = worldStart;
bim.WorldEnd = worldEnd;
Display the updated blocked image. To use the correct units label, parent the image display to a Viewer object with a SpatialUnits property value of "mm". Note that the SpatialUnits property only affects the annotation label text. The world coordinates of the blockedImage object determine the values of spatial coordinates in the displayed image. You can also change the zoom indicator to a measurement scale bar by specifying the ScaleBarStyle property as "measure".
viewer = viewer2d(ScaleBar = "on",SpatialUnits="mm",ScaleBarStyle="measure");
imageshow(bim,Parent=viewer);
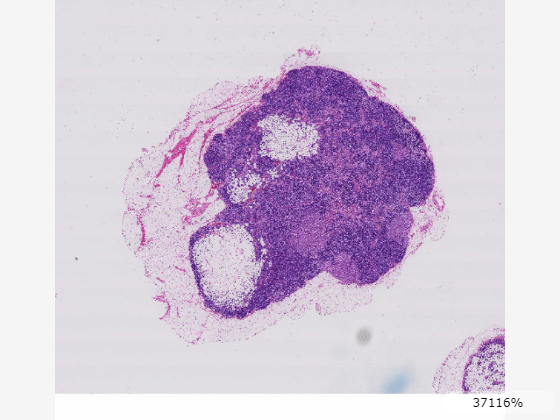
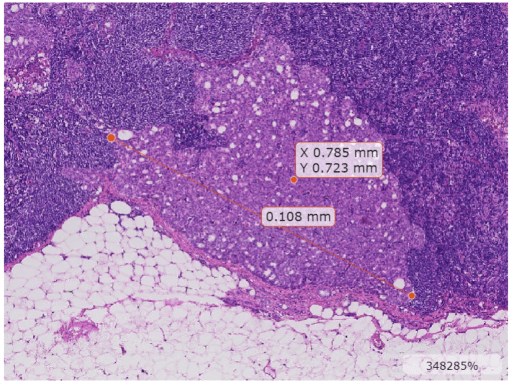
You can measure coordinates and distances using point and line annotations. To add a point annotation, in the viewer toolstrip, select the point annotation tool ![]() . Click the image to place the point. You can move the annotation by dragging the point, not the label. To add a line annotation, in the viewer toolstrip, pause on the point annotation icon
. Click the image to place the point. You can move the annotation by dragging the point, not the label. To add a line annotation, in the viewer toolstrip, pause on the point annotation icon ![]() , and then select the line tool
, and then select the line tool ![]() . This image shows a point and line annotation indicating the approximate center and width of a tumor region in the lower right area of the tissue.
. This image shows a point and line annotation indicating the approximate center and width of a tumor region in the lower right area of the tissue.
Display Overlay Data
The simplest way to display an overlay over a blocked image is to specify the overlay data as single-level blockedImage object. The overlay data should have a similar aspect ratio as the underlying image.
Load the file as a blocked image with default spatial referencing.
bim = blockedImage("tumor_091R.tif");Create a tissue mask by thresholding the image at the second resolution level. The overlay should be created for a coarse resolution level that fits in memory. The apply function applies the specified operation to the blockedImage data block-by-block.
bmask = apply(bim,@(im)im2gray(im.Data)<200,Level=2);
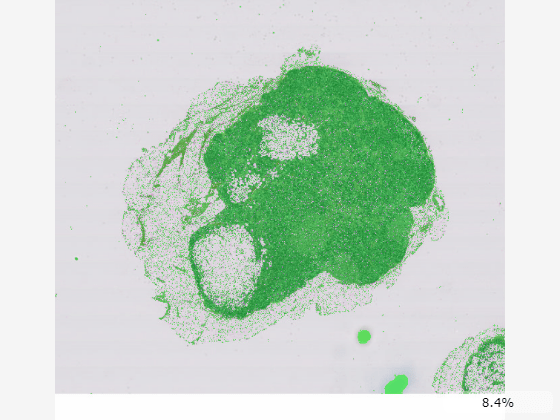
Display the blocked image with the mask as an overlay. Specify the overlay colormap as green.
imageshow(bim,OverlayData=bmask,OverlayColormap=[0 1 0]);
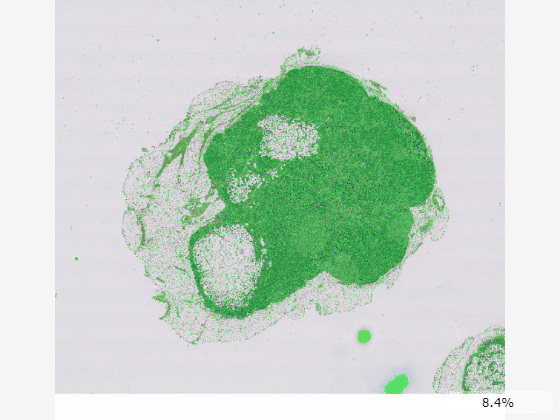
You can also specify the OverlayData property as a multilevel blocked image, as long as the blockedImage objects specified as the image data and overlay data have the same Size, BlockSize, NumLevels, WorldStart, and WorldEnd property values. This code creates the thresholded mask at all three resolution levels of the original image and concatenates them into a single blocked image.
bim1 = apply(bim,@(im)im2gray(im.Data)<200,Level=1);
bim2 = apply(bim,@(im)im2gray(im.Data)<200,Level=2);
bim3 = apply(bim,@(im)im2gray(im.Data)<200,Level=3);
bmask = concatenateLevels(bim1,bim2,bim3);
bmask.BlockSize = bim.BlockSize(:,1:2);
Display the overlay as a blocked image. Similar to the underlying image data, the viewer automatically changes which resolution level of the overlay is displays based on the current zoom level and screen size.
im = imageshow(bim,OverlayData=bmask,OverlayColormap=[0 1 0]);
Adjust Overlay Appearance
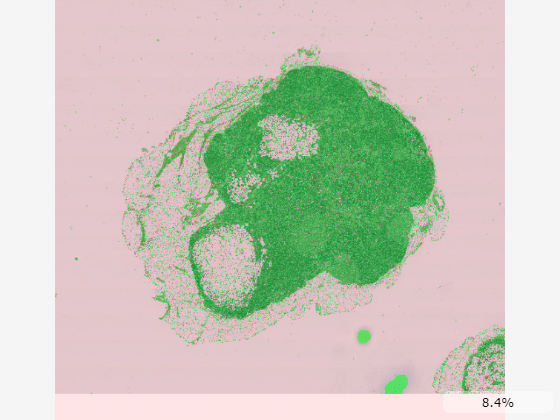
The simplest was to control the transparency of the overlay is to update the OverlayAlpha property, which always displays the overlay with a uniform transparency and the background as transparent. For example, set OverlayAlpha to 1 to display the mask as fully opaque.
You can specify a nonuniform transparency map using the OverlayAlphamap property. Display the background in red with 10% opacity and the mask in green with 50% opacity. Specify the OverlayDisplayRangeMode to map the range of transparency values to the data range of the overlay.
imageshow(bim, ...
    OverlayData=bmask, ...
    OverlayColormap=[1,0,0;0,1,0], ...,
    OverlayDisplayRangeMode="data-range", ...
    OverlayAlphamap=[0.1 0.5]);
See Also
imageshow | blockedImage | apply