显示多个图像
本页描述同时显示多个二维图像的选项。有关 Image Processing Toolbox™ 中的显示功能的概述,请参阅Choose Approach to Display 2-D and 3-D Images。
加载图像
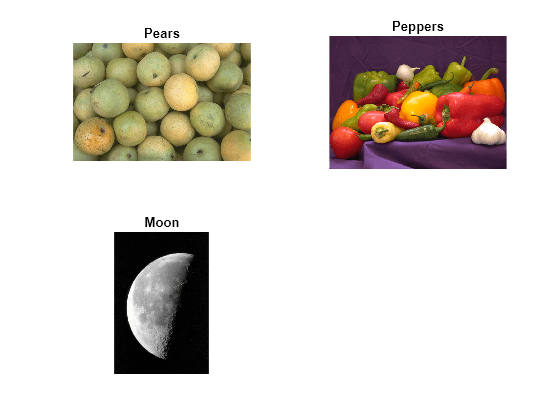
将三个图像读入工作区中。
pears = imread("pears.png");
peppers = imread("peppers.png");
moon = imread("moon.tif");
单独显示图像
使用 imshow 函数一次显示一个图像。在实时编辑器中,每个 imshow 调用都将图像显示为一个单独的输出。在纯代码脚本或 MATLAB® 命令行窗口中,每次调用 imshow 都会替换当前图窗中的图像。要在每个图像自身的图窗中显示该图像,请使用 figure 命令在对 imshow 的各次调用之间创建一个新图窗窗口。
imshow(pears)
figure
imshow(peppers)

您可以使用名称-值参量来自定义 imshow 显示图像的方式。例如,以下代码使用 turbo 颜色图以 50% 的放大倍率显示月球图像。
figure
imshow(moon,Colormap=turbo,InitialMagnification=50)

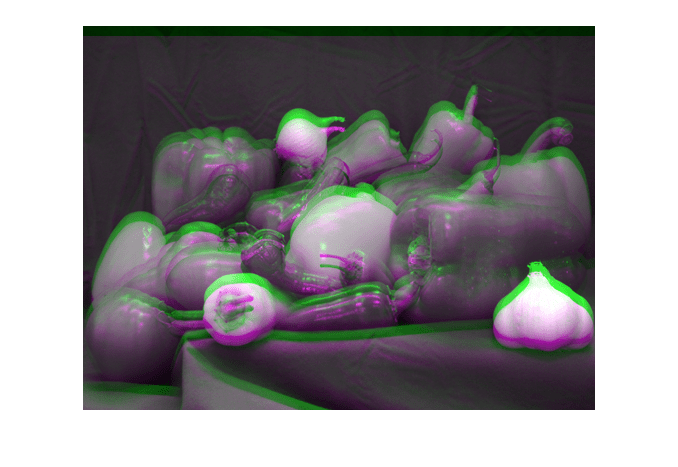
显示一对图像
使用 imshowpair 函数以叠加或蒙太奇方式显示两个图像。
平移辣椒图像的副本,并将其与原始图像进行比较。默认情况下,imshowpair 将图像转换为灰度,并将其显示为假彩色叠加。
peppersTranslate = imtranslate(peppers,[0 10]);
imshowpair(peppers,peppersTranslate)
您也可以指定用于显示图像的方法作为第三个输入参量。例如,使用 alpha 混合显示图像。
imshowpair(peppers,peppersTranslate,"blend") 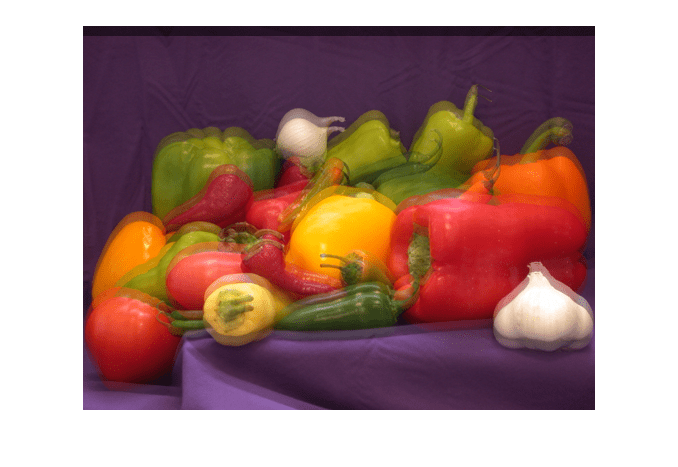
其他选项包括以蒙太奇、棋盘格或差异图像方式显示图像。下图显示每个选项的图像显示方式。
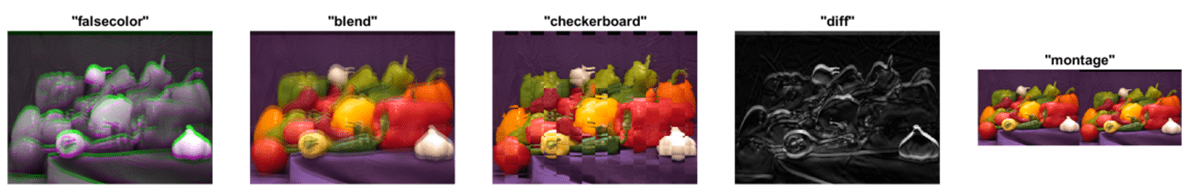
"montage" 方法的输出通常类似于 montage 函数的输出。不过,尽管 montage 始终将所有图像的强度一起重新缩放到相同的显示范围,但您可以通过指定 Scaling 名称-值参量来选择 imshowpair 是单独缩放图像显示范围、一起缩放图像显示范围,还是不应用缩放。有关详细信息,请参阅 imshowpair 和 montage 参考页。
以蒙太奇方式显示多个图像
使用 montage 函数将多个图像以相邻图像形式显示。
您可以通过各种方式指定要显示的图像,例如使用多帧数组、文件名列表或图像数据存储。您还可以指定图像体作为输入,以蒙太奇方式显示三维体切片。要显示不同大小的图像,如此示例所示,请指定一个由矩阵组成的元胞数组。默认情况下,montage 按行和列排列图像,大致形成正方形。该函数会缩放每个图像以适合以蒙太奇方式显示,同时保留其原始纵横比。
imagelist = {pears moon peppers peppersTranslate};
figure
montage(imagelist)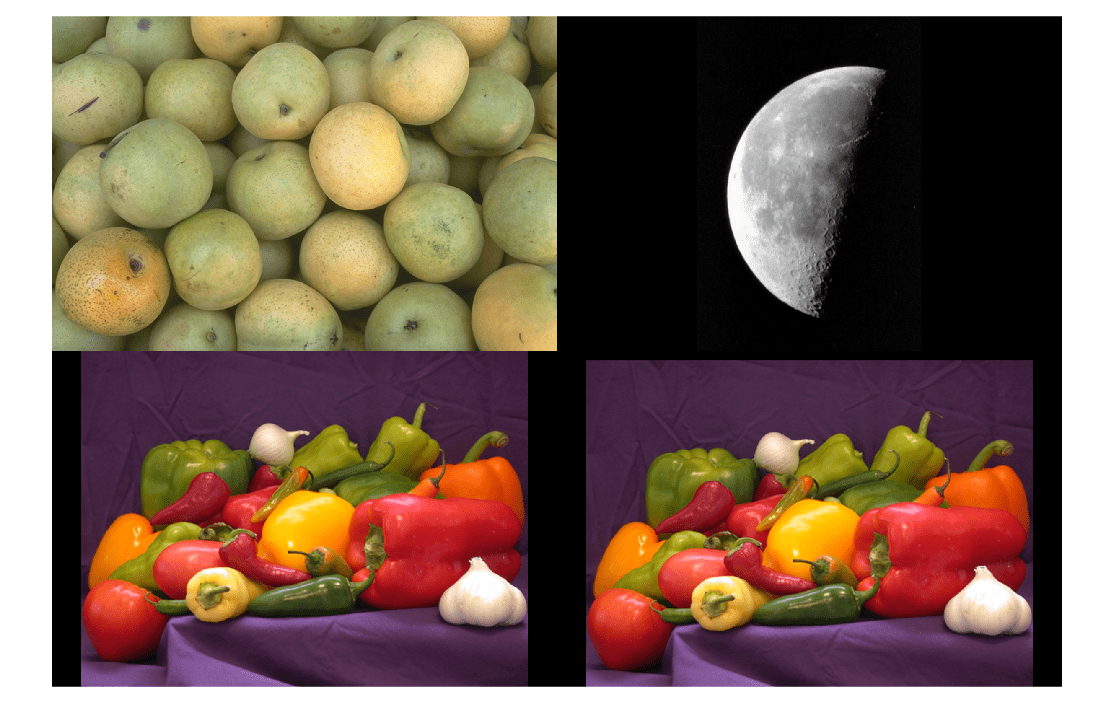
您可以使用名称-值参量自定义特征,例如要显示多帧数组中的哪些图像、图像之间的间距以及图像之间的背景颜色。例如,以下代码将图像显示为具有白色背景的一行图像。
figure
montage(imagelist,Size=[1 NaN],BackgroundColor="white")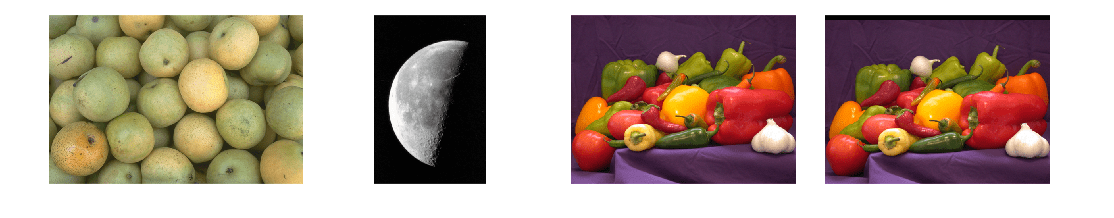
将图像显示为分块布局
使用 tiledlayout 函数显示具有不同标题、颜色图和颜色栏的多个图像。
要创建分块布局,请使用 tiledlayout 函数指定要包含的行数和列数。接下来,调用 nexttile 函数将一个坐标区对象放到布局中。然后,调用 imshow 在坐标区中显示图像。您可以选择为图块指定其他详细信息,如标题。当您准备好移至下一个图块时,请使用 nexttile 函数。
figure
tiledlayout(2,2)

nexttile
imshow(pears)
title("Pears")

nexttile
imshow(peppers)
title("Peppers")

nexttile
imshow(moon)
title("Moon")
您可以使用 tiledlayout 在单个图窗或一个实时编辑器输出中使用多个颜色图来显示一个灰度图像。
figure
tiledlayout(1,2);

nexttile
imshow(moon)
colorbar
title("Moon - Original")

nexttile
imshow(moon,turbo)
colorbar
title("Moon - Turbo")

您也可以将 tiledlayout 与 linkaxes 函数配合使用,以在缩放和平移时保持图像同步。当使用 nexttile 函数移至要链接的图块时,请包含一个输出参量以返回该图块的坐标区对象。然后,通过将图块的返回坐标区指定给 linkaxes 函数来链接它们。
moonfilt = imgaussfilt(moon,2);

figure
tiledlayout(1,2)

ax1 = nexttile;
imshow(moon)
title("Original")

ax2 = nexttile;
imshow(moonfilt)
title("Filtered")

linkaxes([ax1 ax2])
缩放到两个图像中的相同子区域。您也可以使用图窗窗口中的坐标区工具栏以交互方式进行缩放或平移。
xlim([100 150])
ylim([120 180])

显示标注图像
对于二值图像、数值图像和分类标注图像,可以使用 labeloverlay 函数显示标注图像;或者使用 imoverlay 函数仅显示二值标注图像。labeloverlay 和 imoverlay 函数会创建一个在原始图像上叠加标注图像的融合图像。您可以使用任何显示函数显示融合图像,例如 imshow 或 imshowpair。
例如,使用分水岭分割为梨图像创建一个数值标注图像。
pearscomp = imcomplement(im2gray(pears));
pearsfilt = imhmin(pearscomp,30);
pearslabel = watershed(pearsfilt);
创建一个在原始图像上叠加标注的融合图像。
pearsoverlay = labeloverlay(pears,pearslabel);
显示融合图像。
figure
imshow(pearsoverlay)

使用阈值法创建月球的二值掩膜。
t = graythresh(moon);
BW = imbinarize(moon,t);
创建一个在原始图像上叠加掩膜的融合图像。
B = imoverlay(moon,BW);
并排显示原始月球图像和融合的叠加图像。
figure
imshowpair(moon,B,"montage")
另请参阅
imshow | imshowpair | montage | tiledlayout | labeloverlay | imoverlay