houghlines
基于霍夫变换提取线段
说明
示例
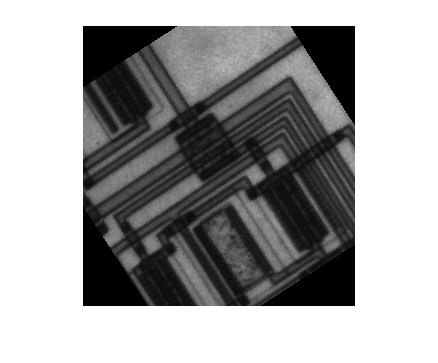
将一个图像读入工作区,然后将图像绕其中心逆时针旋转 33 度。
I = imread("circuit.tif");
rotI = imrotate(I,33,"crop");
通过使用 edge 函数找到图像中的边缘。
BW = edge(rotI,"canny");计算旋转后的二值图像的霍夫变换。
[H,theta,rho] = hough(BW);
通过使用 houghpeaks 函数,在霍夫变换矩阵 H 中找到最多五个峰值。
maxpeaks = 5;
thresh = ceil(0.3*max(H(:)));
P = houghpeaks(H,maxpeaks,Threshold=thresh);
找到长度至少为 7 个像素的线条。在对线条长度计数之前,填充小于 5 个像素的间隙。
lines = houghlines(BW,theta,rho,P,FillGap=5,MinLength=7);
显示原始图像,然后以绿色叠加检测到的线条。还以黄色绘制每个线条的起点,以红色绘制每个线条的终点。
imshow(rotI)
hold on
for k = 1:length(lines)
   xy = [lines(k).point1; lines(k).point2];
   plot(xy(:,1),xy(:,2),LineWidth=2,Color="green");
   plot(xy(1,1),xy(1,2),"x",LineWidth=2,Color="yellow");
   plot(xy(2,1),xy(2,2),"x",LineWidth=2,Color="red");
end
输入参数
名称-值参数
输出参量
扩展功能
版本历史记录
在 R2006a 之前推出