sliceViewer
Browse image slices
Description
A sliceViewer object displays individual slices of grayscale and
RGB volumes. You can control which slice to display by using a slider.
When it opens, the sliceViewer object displays the middle image in the
stack in the direction specified by sliceDirection. Use the slider to
navigate through the volume and view individual slices.

The sliceViewer object supports properties, object functions, and events
that you can use to customize its appearance and functioning. The sliceViewer
object can send notifications when certain events occur, such as the slider moving. For more
information, see Events.
Note
By default, clicking and dragging the mouse in the slice displayed interactively changes their brightness and contrast, a technique called window/level. Dragging the mouse horizontally from left to right changes the contrast. Dragging the mouse vertically up and down changes the brightness. Holding down the Ctrl key when clicking and dragging the mouse accelerates changes. Holding down the Shift key while clicking and dragging the mouse slows the rate of change. Press these keys before clicking and dragging. To control this behavior, use the DisplayRangeInteraction property.
Creation
Description
sliceViewer( displays the grayscale or RGB
volume V)V in a figure. The figure includes a slider that you can use
to view individual slices of the volume.
sliceViewer( sets writeable
properties using
one or more name-value arguments.V,Name=Value)
Example: sliceViewer(V,Colormap=cmap) creates a
sliceViewer object and specifies the colormap used to display the
volume.
sv = sliceViewer(___) returns a
sliceViewer object, sv, with properties that can
be used to control visualization of the volume. Use input arguments from any of the
previous syntaxes.
Note
Medical Imaging Toolbox™ extends the functionality of the sliceViewer (Image Processing Toolbox™) object to display the slices of a medicalVolume (Medical Imaging Toolbox)
object. For more information, see sliceViewer (Medical Imaging Toolbox).
Input Arguments
Properties
Object Functions
addlistener | Create event listener bound to event source |
getAxesHandle | Get handle to axes in Slice Viewer |
Examples
Load MRI data into the workspace.
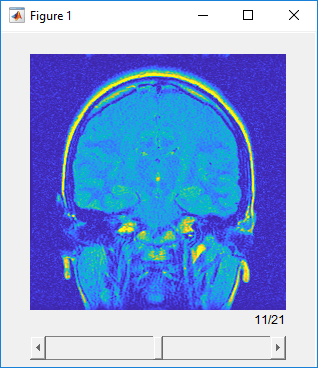
load mristackView the data in the slice viewer, specifying a custom colormap for viewing the slices. The slice viewer opens the stack of images and displays the one in the middle. Use the slider to view a different slice.
cmap = parula(256);
s = sliceViewer(mristack,"Colormap",cmap,"Parent",figure);

Load MRI data into the workspace.
load mristackView the data in the slice viewer.
s = sliceViewer(mristack,"Parent",figure);Get the handle of the axes containing the displayed slice.
hAx = getAxesHandle(s);
Specify the name of the GIF file you want to create.
filename = "animatedSlice.gif";Create an array of slice numbers.
sliceNums = 1:21;
Loop through the slice numbers and create an image of each displayed slice. Write the images to a GIF file.
for idx = sliceNums
    % Update slice number
    s.SliceNumber = idx;
    % Use getframe to capture image
    I = getframe(hAx);
    [indI,cm] = rgb2ind(I.cdata,256);
    % Write frame to the GIF file
    if idx == 1
        imwrite(indI,cm,filename,"gif","Loopcount",inf,"DelayTime", 0.05);
    else
        imwrite(indI,cm,filename,"gif","WriteMode","append","DelayTime", 0.05);
    end
end
Load a stack of images into the workspace.
load mristackView the data in the slice viewer, specifying a custom colormap for viewing the slices. The slice viewer opens the stack of images and displays the one in the middle. Use the slider to view a different slice.
cmap = parula(256);
s = sliceViewer(mristack,"Colormap",cmap,"Parent",figure);
Set up listeners for the two sliceViewer object slider events: when the slider is moving and when the slider has been moved. When you move the slider, the slice viewer sends notifications of these events and executes the specified callback function.
addlistener(s,"SliderValueChanging",@allevents);
addlistener(s,"SliderValueChanged",@allevents);
Use this allevents callback function to display the name of each event and the current position of the slider.
function allevents(src,evt)
    evname = evt.EventName;
    switch(evname)
        case{"SliderValueChanging"}
            disp("Slider value changing event: " + mat2str(evt.CurrentValue));
        case{"SliderValueChanged"}
            disp("Slider value changed event: " + mat2str(evt.CurrentValue));
    end
end
More About
Version History
Introduced in R2019b