Create and Export Labels and Label Definitions
After loading the point cloud data into the Lidar Labeler app, create label definitions and attributes. Label definitions contain information about the labels that you can annotate the points with.
For more information on how to load and view data in the Lidar Labeler app, see Load and View Point Cloud Data.
Create an ROI Label Definition
An ROI label is a label that corresponds to a region of interest (ROI).
On the ROI Labels tab in the left pane, click Label.
Specify the label type as
Cuboid,Line,Voxeland provide a name for the label.
From the
Grouplist, selectNew Groupand provide a name for the group. The group name appears on the ROI Labels tab with the specified label name under it. Adding labels to groups is optional.You can also add a label description.
Click OK to create the label definition.
For more details about these labels, see ROI Labels and Attributes.
Tip
To learn to label point cloud data using tutorials within the
app, click Tutorials in the
Resources section, and select a
desired tutorial from these options:
Cuboid,
Line,
Voxel, Smart
Voxel, and Voxel
Plane.
Create Voxel Label
When you define a Voxel ROI label, the app opens the Voxel tab. You can draw and fine-tune the voxel regions on a point cloud to label them.

Tip
To undo or redo a labeling action in the Voxel tab, press Ctrl+Z or Ctrl+Y, respectively.
Create ROI Attribute
An ROI attribute specifies additional information about an ROI label. You can define ROI attributes of these types.
Numeric Value— Specify a numeric scalar attribute, such as the number of doors on a labeled vehicle.String— Specify a string scalar attribute, such as the color of a vehicle.Logical— Specify a logical true or false attribute, such as whether a vehicle is in motion.List— Specify a drop-down list attribute of predefined strings, such as make or model of a vehicle.
Use this process to create an attribute.
On the ROI Labels tab in the left pane, select a label and click Attribute.
Provide an attribute name and select the attribute type. Optionally, give the attribute a description, and click OK. You can hover over the information icon that appears next to the attribute field to display the added description.

For more details about these attributes, see ROI Labels and Attributes.
Create Scene Label Definition
A scene label defines additional information across a scene. Use scene labels to describe conditions, such as lighting and weather, or events, such as lane changes.
Use this process to create a scene label definition.
Select the Scene Labels tab in the left pane of the app and click Define new scene label.
In the Define new scene label window provide a name for the label.
Choose a Color for the label.

From the
Grouplist, selectNew Groupand provide a name for the group. Adding labels to groups is optional.The Scene Labels pane shows the scene label definition.
Label Data in Burst Mode
Use Burst Mode to label static objects across various point cloud frames at once.
In the range slider pane, click Burst Mode to begin labeling data in burst mode.
Specify the frame numbers in which you want to label objects. The app displays the specified frames in the visualization pane.
Draw labels on static objects. The app applies labels across all specified frames.
Verify the drawn labels across the specified point cloud frames and then exit burst mode labeling by selecting Accept and Exit.
Burst mode can be useful when the input data has a large number of frames with static objects.
View and Adjust Labels
Once you have created labels for your point cloud data, the app toolstrip provides options on the LIDAR tab, to view and adjust your point cloud and label data. These options enable you to more easily label sparse 3-D data points.
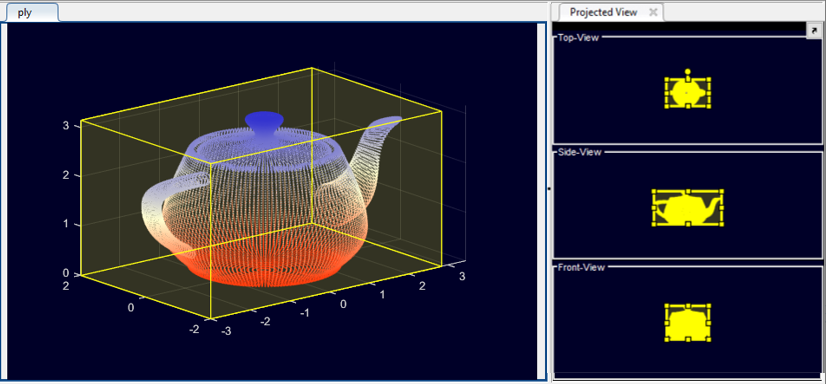
Projected View
Select Projected View to view the front-view, top-view, and side-view of the selected label simultaneously. Use these views to manually adjust the accuracy of your labels.
Auto Align Labels
Select Auto Align to fit a cuboid accurately to the label data and align the label in the direction of the object. This image shows the difference between a label with and a label without the Auto Align option selected.
| Label without Auto Align option | Label with Auto Align option |
|
|


Snap and Shrink Labels
On the LIDAR tab, use these options to snap and shrink your labels to fit the points.
Shrink To Fit — Shrink the size of cuboid labels to best fit the labeled points.
Snap To Cluster — Snap labels to best fit the selected point clusters. You can also specify which clustering algorithm to use to fine-tune the point clusters, by selecting Cluster Settings.

Select
Range-based
                                                  clustering
to cluster point cloud data using thesegmentLidarDatafunction. This option is not applicable for unorganized point cloud data.Select
Distance-based
                                                  clustering
to cluster point cloud data using thepcsegdistfunction.Select
DBSCAN
                                                  clustering
to cluster point cloud data using a density-based spatial clustering of applications with noise (DBSCAN) clustering algorithm, where each point of a valid cluster must have at least a minimum number of neighboring points within a given radius.
You can specify the algorithm parameters in the Cluster Settings dialog box. To visualize the output point cloud clusters, select the View Clusters parameter.
Snap to Point — Snap the line label vertex to the nearest point in the point cloud.
Tip
For more visualization options, see Visualize Point Cloud Data.
Export Labels and Save Labeling Session
After labeling your point cloud data, click Export on the LABEL tab to export the labels. You can export the labels and label definitions to a MAT file or to the MATLAB workspace.
If the point cloud data contains voxel labels, you can export point cloud data and associated classification attributes to a LAS/LAZ file. On the LABEL tab, click Export > To LAS/LAZ File. The app opens the Export Voxel Labels dialog box and populates the default values of the Folder Path and Filename parameters. To export to a different location, click Browse. You can also change the value of Filename parameter. If a file with the specified name already exists, the app overwrites the existing file.
The Export Voxel Labels dialog box also shows the mapping between label
definitions of the app and the standard classes of LAS/LAZ file format. To
change the mapping of a label definition, select the desired value of the
respective LAS/LAZ Standard Classes parameter
from the drop-down list.
You can also manage your data by saving and loading app sessions. To save your session, and then reopen it later to continue labeling the same data, on the LABEL tab,
Select Save Session, and then either Save or Save As, to save the current labeling session.
Click New Session, in the dialog box that opens, specify a session folder.
Click Open Session, and select one of the listed recent sessions, or navigate to the folder of a previous session.