Get Started with the Lidar Labeler
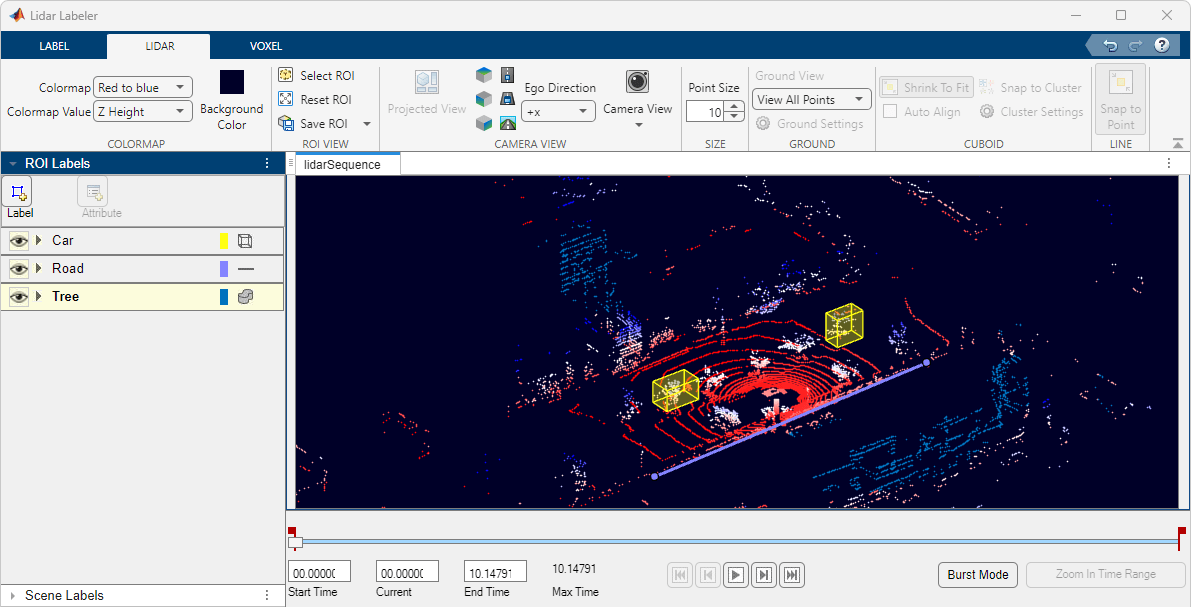
The Lidar Labeler app enables you to interactively label ground truth data in a point cloud or a point cloud sequence and generate corresponding ground truth data.
This example demonstrates the capabilities of the Lidar Labeler app in a lidar ground truth data labeling workflow.
Load Lidar Data to Label
Use the Lidar Labeler app to interactively label point cloud files and sequences of point cloud files.
Open Lidar Labeler App
To open the Lidar Labeler app, at the MATLAB® command prompt, enter this command.
lidarLabeler
The app opens to an empty session.
Alternatively, you can open the app from the Apps tab, under Image Processing and Computer Vision.
Load Signals from Data Sources
The Lidar Labeler app enables you to load signals from multiple types of data sources. In the app, a data source is a file or folder containing one or more signals to label. Use this process to load the data for a point cloud sequence.
On the app toolstrip, click Import > Add Point Cloud. The Select Point Cloud window opens with the Source Type parameter already set to
Point Cloud Sequence
.In the Folder Name parameter, browse to the folder that contains the sequence of point cloud data(PCD) files that you want to load and click Select Folder.
If you have a variable of timestamps in the MATLAB workspace, set the Timestamps parameter to
From Workspace
and, in theImport From Workspace
window, select the variable and click OK. Otherwise, set it toUse Default
.In the Select Point Cloud window, click OK. The point cloud sequence loads into the app.
You can also load point cloud data from:
Velodyne LiDAR® sensors. You can additionally specify the calibration file and the device model.
Custom source, by specifying a custom reader function. Source Name specifies the path to the data folder.
LAS or LAZ file.
Rosbag file.
Create Labels and Attributes
After loading the point cloud data into the Lidar Labeler app, create
label definitions and attributes. Label definitions contain
the information about the labels that you wish to annotate the points with. You can
create label definitions interactively within the app or programmatically by using a
labelDefinitionCreatorLidar
object.
Create an ROI Label Definition
An ROI label is a label that corresponds to a region of interest (ROI).
On the ROI Labels tab in the left pane, click Label.
You can create
Cuboid
,Line
,Voxel
label types and provide names for the labels.From the
Group
list, selectNew Group
and provide a name for the group. Adding labels to groups is optional.The specified group name appears on the ROI Labels tab with the specified label name under it.
For more details about these labels, see ROI Labels and Attributes.
Create Voxel Label
When you define a Voxel
ROI label, the app opens the
Voxel tab. You can draw and fine-tune the voxel regions on
a point cloud to label them.
Create ROI Attribute
An ROI attribute specifies additional information about an ROI label. You can define ROI attributes of these types.
Numeric Value
— Specify a numeric scalar attribute, such as the number of doors on a labeled vehicle.String
— Specify a string scalar attribute, such as the color of a vehicle.Logical
— Specify a logical true or false attribute, such as whether a vehicle is in motion.List
— Specify a drop-down list attribute of predefined strings, such as make or model of a vehicle.
Use this process to create an attribute.
On the ROI Labels tab in the left pane, select a label and click Attribute.
Provide a name in the Attribute Name box. Select the attribute type and optionally give the attribute a description, and click OK. You can hover over the information icon that appears next to the attribute field to display the added description.
For more details about these attributes, see ROI Labels and Attributes.
Create Scene Label Definition
A scene label defines additional information across a scene. Use scene labels to describe conditions, such as lighting and weather, or events, such as lane changes.
Use this process to create a scene label definition.
Select the Scene Labels tab in the left pane of the app and click Define new scene label.
In the Define new scene label window provide a name for the label.
Choose a Color for the label.
From the
Group
list, selectNew Group
and provide a name for the group. Adding labels to groups is optional.The Scene Labels pane shows the scene label definition.
Label Point Cloud Using Automation
You can use an automation algorithm to automatically label your data by using one of the included algorithms or by creating and importing a custom automation algorithm. For more details on creating a custom automation algorithm, see Create Automation Algorithm for Labeling. The app includes the Lidar Object Tracker and Point Cloud Temporal Interpolator labeling automation algorithms.
Use this process to label point cloud data using an automation algorithm.
Load the data into the app and create a ROI label definition.
On the LABEL tab of the app toolstrip, in the Automate Labeling section, click Select Algorithm.
Select an algorithm for automation.
Click Automate and then follow the automation instructions in the right pane of the app.
Color Controls
On the LIDAR tab of the app toolstrip, the app provides various visualization features to analyze point cloud data. The app uses color to visualize more details about the displayed point cloud.
View and Adjust the Labels
Once you have created labels for your point cloud data, the app provides options for viewing, adjusting, and comparing your point cloud and label data.
Projected View
On the LIDAR tab of the app toolstrip, click Projected View to view the selected label in front-view, top-view, and side-view simultaneously. Use these views to manually adjust the accuracy of your labels.
Enable the Auto Align option to fit the cuboid to the label data and align the label in the direction of the object. This image shows the difference in a label with and without the Auto Align option enabled.
Label without Auto Align option | Label with Auto Align option |
|
|
ROI View
You can define and view a region of interest (ROI) in the point cloud using the
ROI View on the LIDAR tab, and then
select Select ROI
.
The app opens the Adjust ROI Limits
dialog box, which
contains the ROI parameters.
To specify x-, y-, and z-axes limits for the ROI, drag the corresponding minimum and maximum value sliders. Alternatively, you can type new minimum or maximum values in the corresponding text boxes. You can also adjust the displayed point size of the point cloud using the Point Size parameter. Use this to improve visualizations of sparse point clouds by increasing their point size. If you want to return to the full view of the point cloud, click ROI View and select Full View.
Camera View Options
On the LIDAR tab, the app provides various predefined camera angles for viewing the point cloud data, as well as the option to create custom views:
Sync Image Viewer
Connect an external tool to the application to display time-synchronized images
for use as reference while labeling. See the lidar.syncImageViewer.SyncImageViewer
class. The following example
shows how to connect an external image display to the Lidar
Labeler.
Connect Image Display to Lidar Labeler
Connect an image display tool to the Lidar Labeler app. Use the app and tool to display synchronized lidar and image data.
Specify the name of the lidar data to load into the app.
sourceName = fullfile("lidarSequence");
Connect the video display to the app and display synchronized data.
lidarLabeler(sourceName,"SyncImageViewerTargetHandle",@helperSyncImageDisplay);
Ground Segmentation
The Lidar Labeler app provides ground segmentation feature to hide ground points in the point cloud. Ground removal makes it easier to find objects during labeling. Use this process to hide ground points:
In the LIDAR tab, select Hide Ground to segment and hide the ground points. This also enables the Ground Settings button.
Select Ground Settings to change the ground segmentation algorithm and tune the corresponding parameters.
Select a segmentation algorithm from the drop-down. The app supports these algorithms:
Range-based floodfill
(default) — Segment the ground plane in organized point cloud data using thesegmentGroundFromLidarData
function.Fit ground plane
— Segment the ground plane in organized point cloud data using thepcfitplane
function.Segment ground SMRF
— Segment the ground plane in both organized and unorganized point clouds using thesegmentGroundSMRF
function. Use this algorithm for non-uniform ground planes and aerial lidar data. The default parameters are tuned for aerial data. For ground lidar data, decrease the Max Window Radius parameter to5
and the Elevation Threshold parameter to a value in the range [0.2
,0.3
].
After selecting an algorithm, the dialog box displays the corresponding parameters. You can adjust the parameters using the sliders to improve segmentation results.
View Clusters
On the LIDAR tab of the app toolstrip, select Snap to Cluster to view point cloud clusters for a cuboid label. This enables the Cluster Settings option. Click Cluster Settings to open a dialog box in which you can select from these cluster-based coloring algorithms.
Select
Range-based clustering
to cluster point cloud data using thesegmentLidarData
function.Select
Distance-based clustering
to cluster point cloud data using thepcsegdist
function.Select
k-means clustering
to perform k-means clustering on the points.
You can specify the algorithm parameters in the dialog box, and visualize the output point cloud clusters.
For a line label, you can use the Snap to Point option on the app toolstrip.
Export the Labels
On the LABEL tab of the app toolstrip, select Export Labels > To Workspace. In the Export to workspace
window, leave the default export variable name, gTruth
, and click
OK. The app exports a
object, groundTruthLidar
gTruth
, to the
MATLAB workspace. This object contains the ground truth lidar label data captured from
the app session.
The properties of the groundTruthLidar
object,
gTruth
, contain information about the signal data source, label
definitions, and labels from the associated app session. Display information about the
object and each of its properties using these commands.
gTruth
— Display the properties of thegroundTruthLidar
object.gTruth.DataSource
— Display the information about source of the point cloud data.gTruth.LabelDefinitions
— Display the table of information about label definitions.gTruth.LabelData
— Display the ROI and scene label data.