创建用于选择点要素的交互式地图
R2026b本示例演示了如何制作一张标有世界主要城市、并添加了海岸线和地形的地图。它采用的是改良的布里塞迈斯特方位投影法。该示例包含一些选项代码,允许用户交互式地选择一个位置,并获取最近城市的名称和位置。要查看示例的这一部分,您必须运行完整的示例,将最后一个插图弹出到一个单独的 MATLAB 图形中,然后在 MATLAB 命令行上运行选项代码。
步骤 1:设置地图并渲染全球高程网格
创建一个基于 axesm 的地图。
figure
axesm bries
text(2.8,-1.8,'Briesemeister projection','HorizontalAlignment','right')
framem('FLineWidth',1)
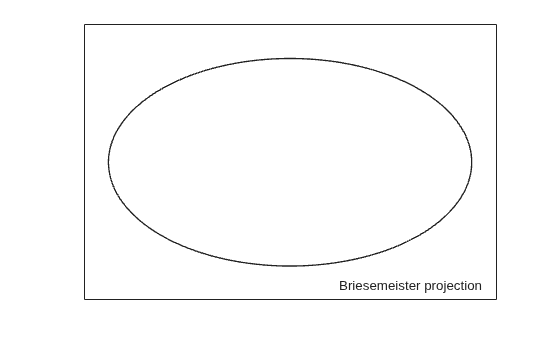
加载高程栅格数据和地理单元参考对象。将数据显示在地图上。
load topo60c
geoshow(topo60c,topo60cR,'DisplayType','texturemap')
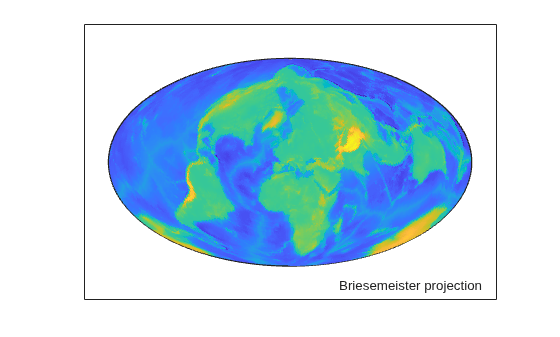
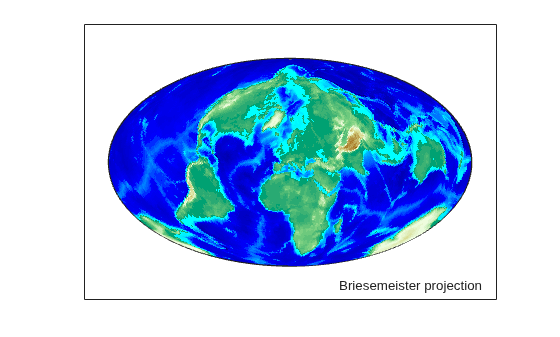
步骤 2:改进地形显示
为高程数据应用合适的颜色图。将屏幕调亮一些。
demcmap(topo60c)
brighten(0.5)
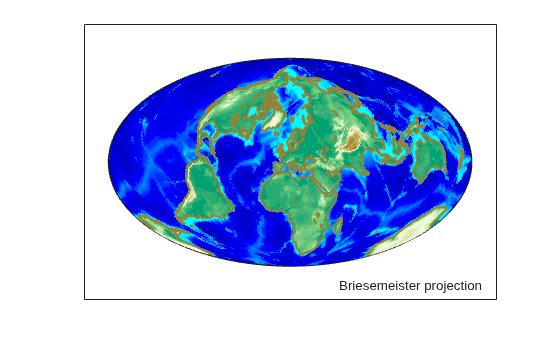
步骤 3:添加简化版海岸线
加载全局海岸线坐标。将海岸线进行泛化处理,容差设为 0.25 度。然后,用棕色绘制海岸线。
load coastlines
[rlat,rlon] = reducem(coastlat,coastlon,0.25);
geoshow(rlat,rlon,'Color',[.6 .5 .2],'LineWidth',1.5)
步骤 4:用红色点标记标注城市位置
读取一个包含全球城市名称及其经纬度坐标的 shapefile 文件。
cities = readgeotable('worldcities.shp');使用 extractfield 提取点的纬度和经度,并将它们添加到地图上。
lats = cities.Shape.Latitude;
lons = cities.Shape.Longitude
lons = 318×1

   -3.9509
   54.7589
   -0.2121
   35.3894
   38.7575
  138.8528
   44.5408
   72.2474
   30.4098
    3.0397
   77.0010
   35.9214
   75.0498
    4.8892
 -149.1074
      ⋮
geoshow(lats, lons,...
        'DisplayType', 'point',...
        'Marker', 'o',...
        'MarkerEdgeColor', 'r',...
        'MarkerFaceColor', 'r',...
        'MarkerSize', 3)
text(-2.8,-1.8,'Major World Cities')
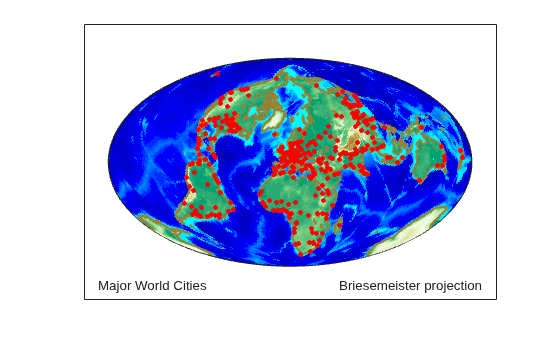
步骤 5:交互式选择城市(选项)
现在,利用您创建的地图,您可以编写一个简单的循环,提示用户点击地图,并显示最近城市的名称和坐标。您必须使用地图顶部出现的按钮,将第 4 步中创建的最后一张地图插入到一个单独的 MATLAB 图形窗口中。此外,在以下代码中,将 runCitySelectionLoop 改为 true,然后在命令行中执行该代码。
该代码首先会在地图左上角显示文字说明。然后,它进入一个循环,在该循环中使用 inputm 捕获选定的纬度和经度。使用 distance 计算每个选定点与数据库中每个城市之间的大圆距离。确定最近城市的索引,更改其标记符号的外观,并显示该城市的名称及经纬度坐标。
runCitySelectionLoop = false; % Set to true to run optional city selection loop

if(runCitySelectionLoop)
    h1 = text(-2.8, 1.9, 'Click on a dot for its city name. Press ENTER to stop');
    h2 = text(-2.8, 1.7, '');
    h3 = text(-2.8, 1.5, 'City Coordinates.');
    while true
        [selected_lat,selected_lon] = inputm(1);
        if isempty(selected_lat)
            break % User typed ENTER
        end
        d = distance(lats, lons, selected_lat, selected_lon);
        k = find(d == min(d(:)),1);
        city = cities(k,:);
        geoshow(city.Shape.Latitude, city.Shape.Longitude, ...
                'DisplayType', 'point', ...
                'Marker', 'o', ...
                'MarkerEdgeColor', 'k', ...
                'MarkerFaceColor', 'y', ...
                'MarkerSize', 3)
       h2.String = city.Name;
       h3.String = num2str([city.Shape.Latitude, city.Shape.Longitude],'%10.2f');
    end
    disp('End of input.')
end

