Main Content

demcmap

Colormaps appropriate to terrain elevation data

Description

demcmap(Z) sets the colormap and color axis limits based on the elevation data limits derived from input argument Z.

  • The default colormap assigns shades of green and brown for positive elevations, and various shades of blue for negative elevation values below sea level.

  • The number of colors assigned to land and to sea are in proportion to the ranges in terrain elevation and bathymetric depth and total 64 by default. The color axis limits are computed such that the interface between land and sea maps to the zero elevation contour.

  • The colormap is applied to the current figure and the color axis limits are applied to the current axes.

example

demcmap(Z,ncolors) creates a colormap of length ncolors.

demcmap(Z,ncolors,cmapsea,cmapland) assigns cmapsea and cmapland to elevations below and above sea level respectively.

example

demcmap('inc',Z,deltaz) chooses number of colors and color axis limits such that each color approximately represents the increment of elevation deltaz.

  • The literal 'inc' signals demcmap that the first argument after Z will be deltaz.

demcmap('inc',Z,deltaz,cmapsea,cmapland)assigns cmapsea and cmapland to elevations below and above sea level respectively.

example

[cmap,climits] = demcmap(___) returns colormap cmap and color axis limit climits, using any of the above syntaxes, but does not apply them to figure or axes properties.

  • Even if only one output argument is specified, no change occurs to figure or axes properties.

Examples

collapse all

Load elevation raster data and a geographic cells reference object. Then, apply a colormap by specifying the maximum and minimum values of the data.

load topo60c
axesm hatano
meshm(topo60c,topo60cR)
zlimits = [min(topo60c(:)) max(topo60c(:))];
demcmap(zlimits)
colorbar

Figure contains an axes object. The axes object contains an object of type surface.

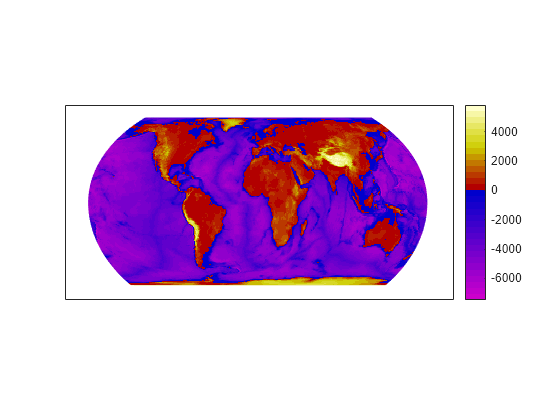
Custom RGB colormaps, for example cmapssea and cmapland, are used to populate figure colormaps by interpolation. The colors in each colormap map to the land and sea regions of the map. Fewer colors have been specified in total than the default number of 64. demcmap determines maximum and minimum elevation data limits internally as shown in the below example when the first argument is the elevation data grid.

load topo60c
axesm hatano
meshm(topo60c,topo60cR)
cmapsea  = [0.8 0 0.8; 0 0 0.8];
cmapland = [0.7 0 0; 0.8 0.8 0; 1 1 0.8 ];
demcmap(topo60c,32,cmapsea,cmapland)
colorbar

Figure contains an axes object. The axes object contains an object of type surface.

The following demcmap example controls the color quantization by choosing an optimal number of colors such that each color represents an elevation increment of approximately 2000.

load topo60c
worldmap('world')
geoshow(topo60c,topo60cR,'DisplayType','texturemap')
demcmap('inc',[max(topo60c(:)) min(topo60c(:))],2000);
colorbar

Figure contains an axes object. The hidden axes object contains 18 objects of type patch, surface, line, text.

Input Arguments

collapse all

Terrain elevation limits specified as a vector or matrix. If Z is a 2 element vector, then it specifies the minimum and maximum limits of terrain elevation data; ordering is not important. If Z is a matrix, then it specifies an elevation grid in which positive and negative values represent points above and below sea level respectively. The above two syntaxes for demcmap are identical in their effect on the figure colormap and axes properties.

Data Types: single | double | int8 | int32 | uint8 | uint16 | uint32

Number of colors in the colormap specified as a scalar. It defines the number of rows m in the mx3 RGB matrix of the figure colormap.

Data Types: double

  • RGB colormaps specified as mx3 arrays containing any number of rows. The two colormaps need not be equal in length. They serve as the basis set for populating the figure colormap by interpolation.

  • cmapsea and cmapland replace the default colormap. The default colormap for land or sea can be retained by providing an empty matrix in place of either colormap matrix.

That part of the figure colormap assigned to negative elevations is derived from cmapssea; cmapland plays a similar role for positive elevations.

Data Types: double

The increment of elevation specified as a scalar. The color quantization of the default or user supplied colormap is adjusted such that each discrete color approximately represents a deltaz increment in elevation.

Data Types: double

Output Arguments

collapse all

RGB colormap returned as a matrix constructed for the figure colormap. Supply output arguments when you want to obtain the colormap and color axis limits without applying them automatically to the figure or axes properties. These properties remain unchanged even if only one output (cmap) is specified.

Data Types: double

Color axis limits returned as a vector. climits may differ somewhat from those derived from input argument Z due to the quantization which results from fitting a limited number of colors over the range limit of the elevation data.

Supply output arguments when you want to obtain the colormap and color axis limits without applying them automatically to the figure or axes.

Data Types: double

Algorithms

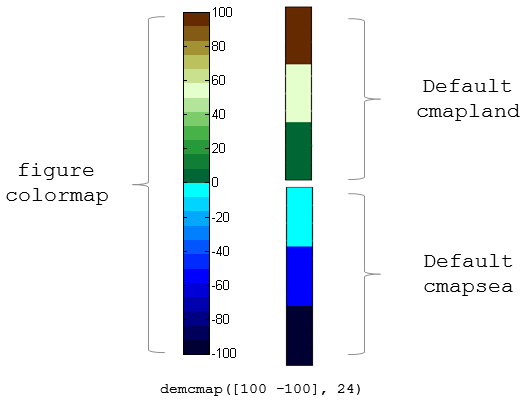
If the elevation grid data contains both positive and negative values, then the computed colormap, cmap, has a “sea” partition of length nsea and "land" partition of length nland. The sum of nsea and nland equals the total number of entries in the computed colormap. The actual values of nsea and nland depend upon the number of entries and the relative range of the negative and positive limits of the elevation data. The sea partition consists of rows 1 through nsea, and the land partition consists of rows nsea + 1 through ncolors. The sea and land partitions of the figure colormap are populated with colors interpolated from the basis RGB colormaps, cmapsea and cmapland. In the figure below, the sea and land 3x3 RGB colormaps shown are the default colors used by demcmap to populate the figure colormap when no user specified colormaps are provided.

Comparison of figure colormap with default cmapland and default cmapsea colormaps

If the elevation grid data contains only positive or negative values, then the figure colormap is derived solely from the corresponding sea or land colormap.

Version History

Introduced before R2006a