addCustomBuildings
Description
addCustomBuildings(
adds buildings from a geospatial table to the list of buildings available for use with
geographic globes. buildingsName,GT)buildingsName is the name you choose to call the
buildings. The buildings remain available for use in future MATLAB® sessions.
To display buildings in a geographic globe, specify the Buildings
property of the GeographicGlobe object.
addCustomBuildings(
specifies the location to write the buildings data.buildingsName,GT,WriteLocation=loc)
Examples
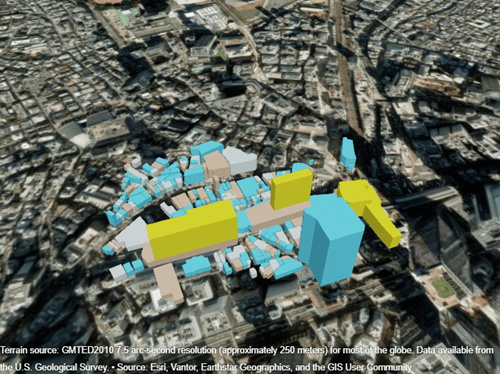
Add buildings from an OpenStreetMap® file to the list of buildings available for use with geographic globes. Display the buildings in a geographic globe. Then, remove the buildings from the list of available buildings.
Read the buildings layer from an OpenStreetMap file [1] into the workspace by using the readgeotable function. The function derives information about the buildings from the file and stores the result in a geospatial table, where each row of the table represents a building. The buildings within the file have edited colors.
GT = readgeotable("shibuya.osm",Layer="buildings");
Add the buildings to the list of buildings available for use with geographic globes by using the addCustomBuildings function. After you add the buildings, you do not need to add them again in future sessions.
addCustomBuildings("shibuya",GT)Create a geographic globe in a figure created using the uifigure function. Display the buildings in the globe by specifying the Buildings name-value argument. The globe displays the buildings using the colors stored in the file.
uif = uifigure;
g = geoglobe(uif,Buildings="shibuya");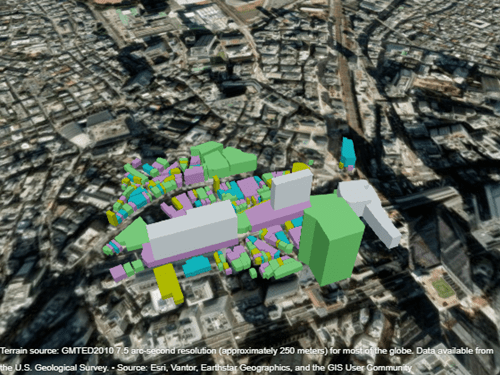
Close the figure. Remove the buildings from the list of available buildings by using the removeCustomBuildings function.
close(uif)
removeCustomBuildings("shibuya")
[1] You can download OpenStreetMap files from https://www.openstreetmap.org, which provides access to crowd-sourced map data all over the world. The data is licensed under the Open Data Commons Open Database License (ODbL), https://opendatacommons.org/licenses/odbl/.
Read buildings from an OpenStreetMap file into a geospatial table, edit the colors stored in the table, and add the edited buildings to the list of buildings available for use with geographic globes. Apply one color to all the buildings, or apply different colors based on the building materials.
Note: The addCustomBuildings function expects the order of the table rows to match the order returned by the readgeotable function. When customizing a geospatial table for use with addCustomBuildings, do not change the order of the table rows.
Import Buildings
Read buildings from an OpenStreetMap file [1] into the workspace by using the readgeotable function. When customizing the colors of building parts, specify the Layer argument as "buildingparts" instead of "buildings". The function derives information about the buildings from the file and stores the result in a geospatial table.
GT = readgeotable("shibuya.osm",Layer="buildingparts");
View the first eight rows of the table. The Shape table variable represents the building footprints using geopolyshape objects. The Color variable represents the building colors using hexadecimal color codes.
head(GT)
       Shape               Centroid              Type       BuildingID     PartID    MinHeight    MaxHeight            Name              Material       Color      RoofShape    RoofDirection
    ____________    _______________________    _________    ___________    ______    _________    _________    _____________________    __________    _________    _________    _____________

    geopolyshape    (35.6582°N, 139.6987°E)    composite    "7544706"        ""          0             72      "渋谷マークシティ"          ""            ""              ""             ""
    geopolyshape    (35.6577°N, 139.7002°E)    standard     "55588118"       ""          0         103.31      "渋谷フクラス"             "glass"       "#3BAA32"       ""             ""
    geopolyshape    (35.6596°N, 139.6987°E)    standard     "55895868"       ""          0             24      "Shibuya 109"            "concrete"    "#3BAA32"       ""             ""
    geopolyshape    (35.6584°N, 139.6999°E)    standard     "60739620"       ""          0              9      "渋谷駅前会館(飯島ビル)"    "stone"       "#027880"       ""             ""
    geopolyshape    (35.6592°N, 139.6999°E)    standard     "60739635"       ""          0             27      "渋谷駅前ビル"             "glass"       "#808000"       ""             ""
    geopolyshape    (35.6593°N, 139.6995°E)    standard     "116710254"      ""          0              9      "ビックカメラ"             "glass"       "#8E4585"       ""             ""
    geopolyshape    (35.6595°N, 139.6983°E)    standard     "116710255"      ""          0             21      "THE PRIME"              "stone"       "#3BAA32"       ""             ""
    geopolyshape    (35.6593°N, 139.6996°E)    standard     "116806276"      ""          0              9      ""                       "concrete"    "#3BAA32"       ""             ""
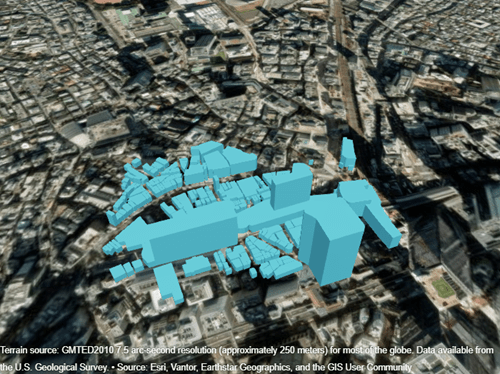
Apply One Color to All Buildings
Apply one color to all the buildings by setting each element of the Color variable to the same value.
To preserve the original data, create a copy of the geospatial table.
oneColorBuildings = GT;
Specify a blue color using a hexadecimal color code. Then, set all elements of the Color variable to the blue color.
blueColor = "#2FBEEF";
oneColorBuildings.Color(:) = blueColor;
Add the buildings to the list of buildings available for use with geographic globes. Then, display the buildings in a geographic globe.
addCustomBuildings("blueShibuya",oneColorBuildings)
blueUIF = uifigure;
blueG = geoglobe(blueUIF,Buildings="blueShibuya");
Apply Color Based on Building Materials
Apply color to the buildings using the building materials reported by the OpenStreetMap file.
Create a new copy of the original geospatial table.
materialColorsGT = GT;
The geospatial table stores the building materials in the Material variable. Query the unique materials.
uniqueMaterials = unique(materialColorsGT.Material)
uniqueMaterials = 4×1 string array
    ""
    "concrete"
    "glass"
    "stone"
Create a dictionary that associates each material with a hexadecimal color code. Use yellow for unspecified materials, gray for concrete, blue for glass, and tan for stone.
colors = ["#FFD60A"; "#D3D3D3"; "#2FBEEF"; "#CB845D"];
dict = dictionary(uniqueMaterials,colors)
dict =

  dictionary (string ⟼ string) with 4 entries:

    ""         ⟼ "#FFD60A"
    "concrete" ⟼ "#D3D3D3"
    "glass"    ⟼ "#2FBEEF"
    "stone"    ⟼ "#CB845D"
Set the building colors. Use the dictionary to find the colors associated with the materials.
materials = materialColorsGT.Material;
materialColorsGT.Color = dict(materials);
Add the buildings to the list of buildings available for use with geographic globes. Then, display the buildings in a geographic globe.
addCustomBuildings("materialsShibuya",materialColorsGT)
materialsUIF = uifigure;
materialsG = geoglobe(materialsUIF,Buildings="materialsShibuya");
[1] You can download OpenStreetMap files from https://www.openstreetmap.org, which provides access to crowd-sourced map data all over the world. The data is licensed under the Open Data Commons Open Database License (ODbL), https://opendatacommons.org/licenses/odbl/.
When you do not want to add buildings from an OpenStreetMap file, you can define simple buildings by specifying the building footprints, the minimum and maximum building heights, and, optionally, the building colors. Then, you can add the buildings to the list of buildings available for use with geographic globes.
Note: This example shows how to define standard buildings, which are right polygonal prisms composed of one part and a flat roof. Defining composite buildings, which are composed of multiple parts and other types of roofs, is not recommended.
Specify Building Footprints
Specify the building footprints by creating polygons.
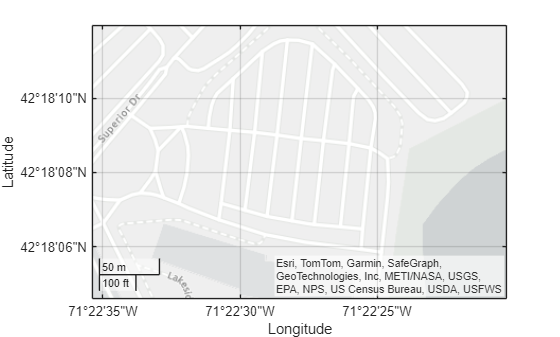
This example add custom buildings for a region near the MathWorks Lakeside campus in Natick, MA. View the region on a map.
figure
geolimits([42.3013 42.3033],[-71.3765 -71.3723])
Specify a building footprint by creating a polygon. Create the polygon using this process:
Identify the vertices of the polygon using geographic coordinates in the World Geodetic System of 1984 (WGS 84). To use predefined vertices, specify
interactivelySelectVerticesasfalse. To interactively select the vertices, specifyinteractivelySelectVerticesastrue.Close the polygon by appending the first vertex to the end of the list of vertices.
For a polygon to have valid topology, the vertices must be in clockwise order. Arrange the vertices by using the
poly2cwfunction.Create a
geopolyshapeobject from the vertices.
interactivelySelectVertices = false;
if interactivelySelectVertices
    [lat1,lon1] = ginput;
else
    lat1 = [42.302543 42.302543 42.302814 42.303206 42.301896 42.301994];
    lon1 = [-71.375094 -71.375338 -71.375257 -71.374536 -71.374759 -71.375185];
end

lat1(end+1) = lat1(1);
lon1(end+1) = lon1(1);

[lon1,lat1] = poly2cw(lon1,lat1);

footprint1 = geopolyshape(lat1,lon1);
Specify a second building footprint by repeating the process.
if interactivelySelectVertices
    [lat2,lon2] = ginput;
else
    lat2 = [42.303037 42.302644 42.301790 42.301828];
    lon2 = [-71.374072 -71.373613 -71.373745 -71.374265];
end

lat2(end+1) = lat2(1);
lon2(end+1) = lon2(1);

[lon2,lat2] = poly2cw(lon2,lat2);

footprint2 = geopolyshape(lat2,lon2);
Prepare to create a geospatial table from the building footprints by collecting the polygons into a column vector.
footprints = [footprint1; footprint2];
Display the building footprints on the map.
hold on
geoplot(footprints)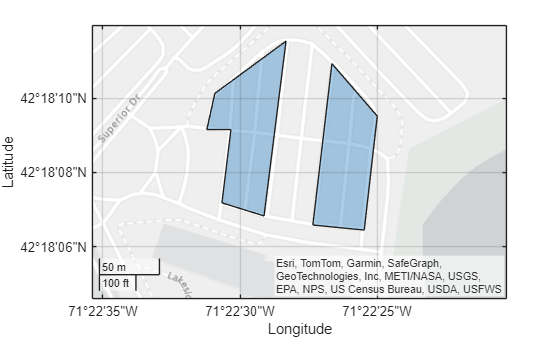
Specify Building Heights
Specify the minimum and maximum height of each building in meters above ground. Prepare to create a geospatial table by storing the height values in column vectors.
minHeights = [0; 0];
maxHeights = [9; 12];
Specify Building Colors
Optionally specify the building colors using hexadecimal color codes. Use tan for the first building and blue for the second building. When you do not specify the building colors, or when you specify a building color using an empty string (""), the geographic globe displays the buildings in gray.
colors = ["#CB845D"; "#2FBEEF"];
Create Geospatial Table
Create a geospatial table from the footprints, the minimum heights, the maximum heights, and the colors. To use the geospatial table as input for the addCustomBuildings function, the names of the table variables must be Shape, MinHeight, MaxHeight, and Color.
GT = table;
GT.Shape = footprints;
GT.MinHeight = minHeights;
GT.MaxHeight = maxHeights;
GT.Color = colors;
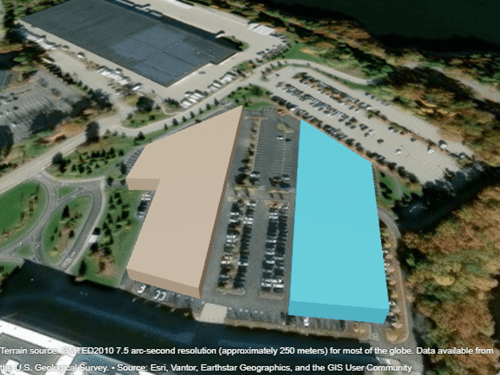
Add Custom Buildings
Add the buildings to the list of buildings available for use with geographic globes. Then, display the buildings in a geographic globe.
addCustomBuildings("customLakeside",GT)
uif = uifigure;
g = geoglobe(uif,Buildings="customLakeside");
Input Arguments
Version History
Introduced in R2026a