clegendm
为地图等高线显示添加图例标签
说明
示例
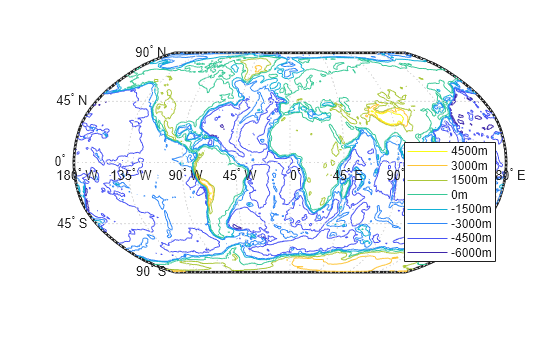
加载高程栅格数据和地理单元参考对象。使用等高线图在世界地图上显示数据。然后,在地图右下角创建图例。指定等高线标高值,单位为米。
load topo60c
worldmap('world')
[c,h] = contourm(topo60c,topo60cR,-6000:1500:6000);
clegendm(c,h,4,'m')
输入参数
输出参量
版本历史记录
在 R2006a 之前推出
为地图等高线显示添加图例标签
加载高程栅格数据和地理单元参考对象。使用等高线图在世界地图上显示数据。然后,在地图右下角创建图例。指定等高线标高值,单位为米。
load topo60c worldmap('world') [c,h] = contourm(topo60c,topo60cR,-6000:1500:6000); clegendm(c,h,4,'m')
在 R2006a 之前推出