flatearthpoly
Clip polygon to world limits
Syntax
[latf,lonf] = flatearthpoly(lat,lon)

[latf,lonf] = flatearthpoly(lat,lon,longitudeOrigin)
Description
[latf,lonf] = flatearthpoly(lat,lon) trims
NaN-separated polygons specified by the latitude and longitude
vectors lat and lon to the limits [-180
180] in longitude and [-90 90] in latitude, inserting
straight segments along the +/- 180-degree meridians and at the poles. Inputs and
outputs are in degrees.
Display functions automatically cut and trim geographic data when required by the map
projection. Use the flatearthpoly function only when performing set
operations on polygons.
[latf,lonf] = flatearthpoly(lat,lon,longitudeOrigin) centers
the longitude limits on the longitude specified by the scalar longitude longitudeOrigin.
Examples
Vector data for geographic objects that encompass a pole must encounter or cross the Antimeridian. While the toolbox properly displays such polygons, they can cause problems for functions that work with Cartesian coordinates, such as polygon intersection functions. When these polygons are treated as Cartesian coordinates, the Antimeridian crossing results in a spurious line segment, and the polygon displayed as a patch does not have the interior filled correctly. You can reformat such polygons by using the flatearthpoly function.
Load the coordinates of global coastlines. Extract the coordinates of the first polygon, which represents Antarctica.
load coastlines
firstnan = find(isnan(coastlat),1,"first");
lat = coastlat(1:firstnan);
lon = coastlon(1:firstnan);
Plot the coordinates that make up the polygon boundary. Note that the boundary is not closed.
plot(lon,lat)
xlim([-200 200])
axis equal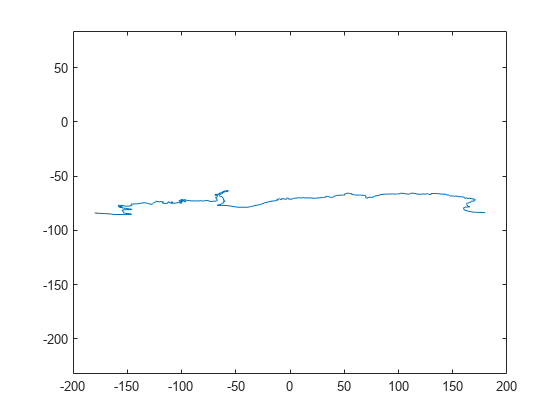
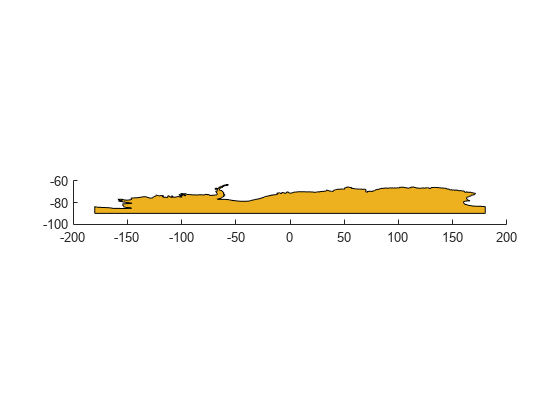
Convert the coastline so that it uses planar polygon topology and plot the result. The polygon boundary meets the Antimeridian, drops down to the pole, sweeps across the longitudes at the pole, and follows the Antimeridian up to the other side of the Antimeridian crossing.
[latf,lonf] = flatearthpoly(lat,lon);
figure
mapshow(lonf,latf,"DisplayType","polygon")
ylim([-100 -60])
Longitude coordinate discontinuities at the Antimeridian can confuse set operations on polygons. To prepare geographic data for use with patch rendering, cut the polygons at the Antimeridian with the flatearthpoly function. The flatearthpoly function returns a polygon with points inserted to follow the Antimeridian up to the pole, traverse the longitudes at the pole, and return to the Antimeridian along the other edge of the Antimeridian.
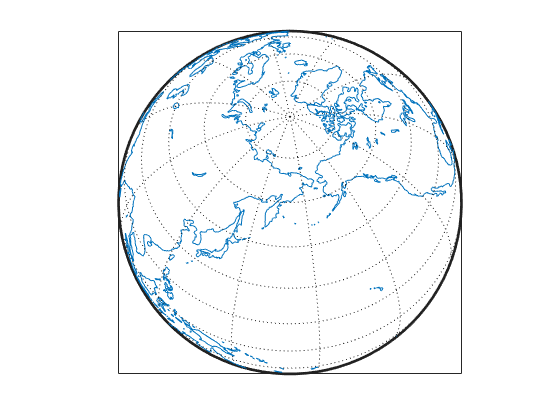
Create an orthographic view of the Earth and plot the coastlines on it.
axesm ortho
setm(gca,'Origin', [60 170]); framem on; gridm on
load coastlines
plotm(coastlat,coastlon)
Generate a small circle that encompasses the North Pole and color it yellow.
[latc,lonc] = scircle1(75,45,30);
patchm(latc,lonc,'y')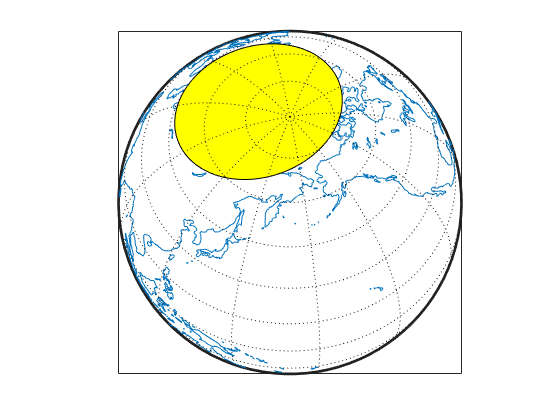
Flatten the small circle using the flatearthpoly function.
[latf,lonf] = flatearthpoly(latc,lonc);
Plot the cut circle that you just generated as a magenta line.
plotm(latf,lonf,'m')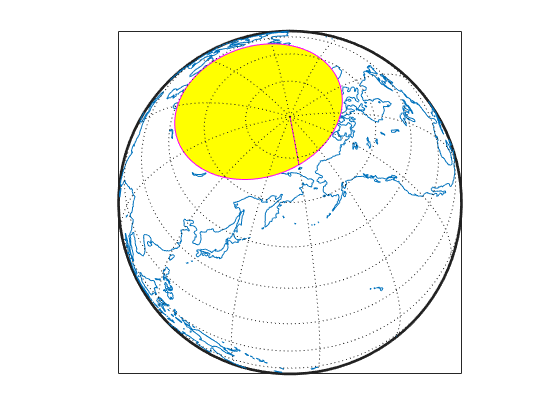
Generate a second small circle that does not include a pole.
[latc1, lonc1] = scircle1(20, 170, 30);
Flatten the circle and plot it as a red line. Note that the second small circle, which does not cover a pole, is clipped into two pieces along the Antimeridian. The polygon for the first small circle is plotted in plane coordinates to illustrate its flattened shape. The flatearthpoly function assumes that the interior of the polygon being flattened is in the hemisphere that contains most of its edge points. Thus a polygon produced by flatearthpoly does not cover more than a hemisphere.
[latf1,lonf1] = flatearthpoly(latc1,lonc1);
plotm(latf1,lonf1,'r')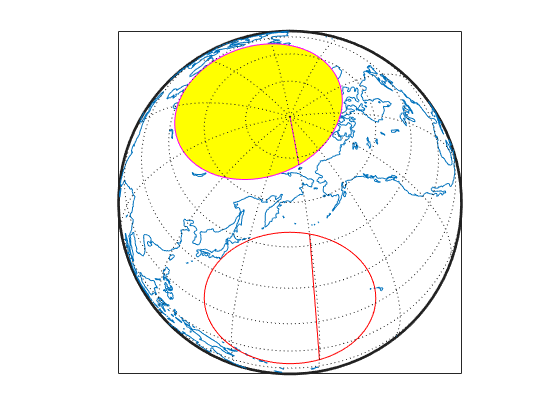
Tips
The polygon defined by lat and lon must be well-formed:
The boundaries must not intersect.
The vertices of outer boundaries must be in a clockwise order and the vertices of inner boundaries must be in a counterclockwise order, such that the interior of the polygon is always to the right of the boundary.
For more information, see Create and Display Polygons.
Version History
Introduced before R2006a