geoloc2grid
R2026b将带地理定位的数据数组转换为规则数据网格
语法
[Z,R] = geoloc2grid(lat,lon,A,cellsize)
描述
[Z,R] = geoloc2grid(lat,lon,A,cellsize) 根据 lat 和 lon 中给定的地理位置点,将地理位置数据数组 A 转换为规则数据网格 Z 以及相应的栅格引用对象 R。cellsize 是一个标量,用于指定规则数据网格中数据单元的宽度和高度,其使用的角度单位与 lat 和 lon 相同。Z 中位于 A 覆盖范围之外的数据单元格将被设置为 NaN。
示例
将一个带有地理位置信息的数据数组加载到工作区中。
load("mapmtx.mat","lt1","lg1","map1")
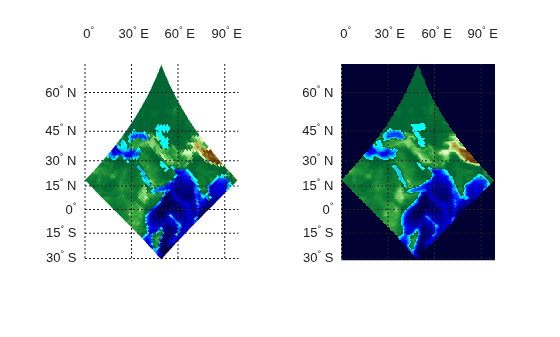
将带地理位置信息的数据数组转换为单元格大小为 0.5 度的标准数据网格。
cellsize = 0.5;
[Z,R] = geoloc2grid(lt1,lg1,map1,cellsize);
以平铺图表布局显示基于地理位置的数据数组和常规数据网格。
latlim = R.LatitudeLimits;
lonlim = R.LongitudeLimits;

figure
tiledlayout(1,2)

nexttile
ax1 = axesm("mercator",MapLatLimit=latlim,MapLonLimit=lonlim, ...
    Grid="on",MeridianLabel="on",ParallelLabel="on");
ax1.Visible = "off";
geoshow(lt1,lg1,map1,DisplayType="texturemap")
demcmap(map1)
title("Geolocated Data Array")

nexttile
ax2 = axesm("mercator",MapLatLimit=latlim,MapLonLimit=lonlim, ...
    Grid="on",MeridianLabel="on",ParallelLabel="on");
ax2.Visible = "off";
geoshow(Z,R,DisplayType="texturemap")
demcmap(Z)
title("Regular Data Grid")
提示
geoloc2grid 提供了一种易于使用的替代方案,用于通过 imbedm 对带有地理位置信息的数据数组进行网格化处理。无需预分配输出映射;输出中不存在数据缺口(即使将 cellsize 设为非常小的值),且输出映射更为平滑。

