Main Content

polybool

Set operations on polygonal regions

polybool is not recommended. Use polyshape instead. For more information, see Version History.

Description

[x,y] = polybool(flag,x1,y1,x2,y2) performs the polygon set operation identified by flag. The result is output using the same format as the input. Geographic data that encompasses a pole cannot be used directly. Use flatearthpoly to convert polygons that contain a pole to Cartesian coordinates.

Most Mapping Toolbox™ functions adhere to the convention that individual contours with clockwise-ordered vertices are external contours and individual contours with counterclockwise-ordered vertices are internal contours. Although the polybool function ignores vertex order, follow this convention when creating contours to ensure consistency with other functions.

example

Examples

collapse all

theta = linspace(0, 2*pi, 100);
x1 = cos(theta) - 0.5;
y1 = -sin(theta);    % -sin(theta) to make a clockwise contour
x2 = x1 + 1;
y2 = y1;
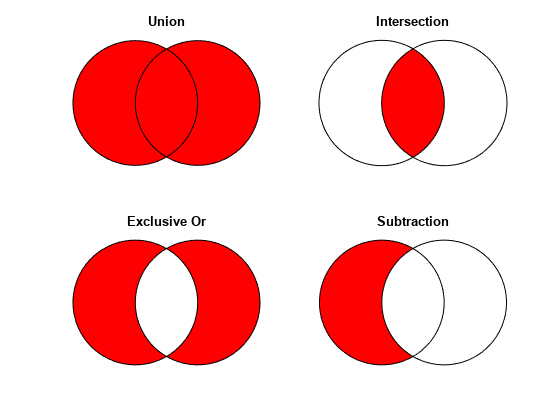
[xa, ya] = polybool('union', x1, y1, x2, y2);
[xb, yb] = polybool('intersection', x1, y1, x2, y2);
[xc, yc] = polybool('xor', x1, y1, x2, y2);
[xd, yd] = polybool('subtraction', x1, y1, x2, y2);

subplot(2, 2, 1)
patch(xa, ya, 1, 'FaceColor', 'r')
axis equal, axis off, hold on
plot(x1, y1, x2, y2, 'Color', 'k')
title('Union')

subplot(2, 2, 2)
patch(xb, yb, 1, 'FaceColor', 'r')
axis equal, axis off, hold on
plot(x1, y1, x2, y2, 'Color', 'k')
title('Intersection')

subplot(2, 2, 3)
% The output of the exclusive-or operation consists of disjoint
% regions.  It can be plotted as a single patch object using the
% face-vertex form.  Use poly2fv to convert a polygonal region
% to face-vertex form.
[f, v] = poly2fv(xc, yc);
patch('Faces', f, 'Vertices', v, 'FaceColor', 'r', ...
  'EdgeColor', 'none')
axis equal, axis off, hold on
plot(x1, y1, x2, y2, 'Color', 'k')
title('Exclusive Or')

subplot(2, 2, 4)
patch(xd, yd, 1, 'FaceColor', 'r')
axis equal, axis off, hold on
plot(x1, y1, x2, y2, 'Color', 'k')
title('Subtraction')

Figure contains 4 axes objects. Hidden axes object 1 with title Union contains 3 objects of type patch, line. Hidden axes object 2 with title Intersection contains 3 objects of type patch, line. Hidden axes object 3 with title Exclusive Or contains 3 objects of type patch, line. Hidden axes object 4 with title Subtraction contains 3 objects of type patch, line.

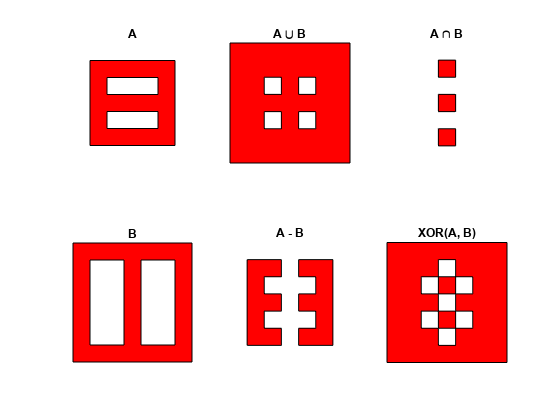
Ax = {[1 1 6 6 1], [2 5 5 2 2], [2 5 5 2 2]};
Ay = {[1 6 6 1 1], [2 2 3 3 2], [4 4 5 5 4]};
subplot(2, 3, 1)
[f, v] = poly2fv(Ax, Ay);
patch('Faces', f, 'Vertices', v, 'FaceColor', 'r', ...
  'EdgeColor', 'none')
axis equal, axis off, axis([0 7 0 7]), hold on
for k = 1:numel(Ax), plot(Ax{k}, Ay{k}, 'Color', 'k'), end
title('A')

Bx = {[0 0 7 7 0], [1 3 3 1 1], [4 6 6 4 4]};
By = {[0 7 7 0 0], [1 1 6 6 1], [1 1 6 6 1]};
subplot(2, 3, 4);
[f, v] = poly2fv(Bx, By);
patch('Faces', f, 'Vertices', v, 'FaceColor', 'r', ...
  'EdgeColor', 'none')
axis equal, axis off, axis([0 7 0 7]), hold on
for k = 1:numel(Bx), plot(Bx{k}, By{k}, 'Color', 'k'), end
title('B')

subplot(2, 3, 2)
[Cx, Cy] = polybool('union', Ax, Ay, Bx, By);
[f, v] = poly2fv(Cx, Cy);
patch('Faces', f, 'Vertices', v, 'FaceColor', 'r', ...
  'EdgeColor', 'none')
axis equal, axis off, axis([0 7 0 7]), hold on
for k = 1:numel(Cx), plot(Cx{k}, Cy{k}, 'Color', 'k'), end
title('A \cup B')

subplot(2, 3, 3)
[Dx, Dy] = polybool('intersection', Ax, Ay, Bx, By);
[f, v] = poly2fv(Dx, Dy);
patch('Faces', f, 'Vertices', v, 'FaceColor', 'r', ...
  'EdgeColor', 'none')
axis equal, axis off, axis([0 7 0 7]), hold on
for k = 1:numel(Dx), plot(Dx{k}, Dy{k}, 'Color', 'k'), end
title('A \cap B')

subplot(2, 3, 5)
[Ex, Ey] = polybool('subtraction', Ax, Ay, Bx, By);
[f, v] = poly2fv(Ex, Ey);
patch('Faces', f, 'Vertices', v, 'FaceColor', 'r', ...
  'EdgeColor', 'none')
axis equal, axis off, axis([0 7 0 7]), hold on
for k = 1:numel(Ex), plot(Ex{k}, Ey{k}, 'Color', 'k'), end
title('A - B')

subplot(2, 3, 6)
[Fx, Fy] = polybool('xor', Ax, Ay, Bx, By);
[f, v] = poly2fv(Fx, Fy);
patch('Faces', f, 'Vertices', v, 'FaceColor', 'r', ...
  'EdgeColor', 'none')
axis equal, axis off, axis([0 7 0 7]), hold on
for k = 1:numel(Fx), plot(Fx{k}, Fy{k}, 'Color', 'k'), end
title('XOR(A, B)')

Figure contains 6 axes objects. Hidden axes object 1 with title A contains 4 objects of type patch, line. Hidden axes object 2 with title B contains 4 objects of type patch, line. Hidden axes object 3 with title A blank cup blank B contains 6 objects of type patch, line. Hidden axes object 4 with title A blank cap blank B contains 4 objects of type patch, line. Hidden axes object 5 with title A - B contains 3 objects of type patch, line. Hidden axes object 6 with title XOR(A, B) contains 5 objects of type patch, line.

Input Arguments

collapse all

Polygon set operation, specified as one of the following values.

Operation     
Region intersection'intersection''and''&'  
Region union'union''or''|''+''plus'
Region subtraction'subtraction''minus''-'  
Region exclusive or'exclusiveor''xor'   

Data Types: char | string

Polygon contours, specified as a NaN-delimited vector or cell array.

Data Types: double

Polygon contours, specified as a NaN-delimited vector or cell array.

Data Types: double

Polygon contours, specified as a NaN-delimited vector or cell array.

Data Types: double

Polygon contours, specified as a NaN-delimited vector or cell array.

Data Types: double

Output Arguments

collapse all

Polygon contour after set operation, returned as a NaN-delimited vector or cell array. The output returns in the same format as the input.

Polygon contour after set operation, returned as a NaN-delimited vector or cell array. The output returns in the same format as the input.

Tips

  • Numerical problems can occur when the polygons have a large offset from the origin. To avoid this issue, translate the coordinates to a location closer to the origin before performing the operation. Then, undo the translation after completing the operation. For example:

    [x,y] = polybool(flag,x1-xt,y1-yt,x2-xt,y2-yt);

    x = x+xt;

    y = y+yt;

Version History

Introduced before R2006a

collapse all

R2018a: polybool is not recommended

polybool is not recommended. Use polyshape instead.

To replace calls to polybool, create polyshape objects to represent the shapes, call the appropriate polyshape object function for the equivalent Boolean operation, and then call the polyshape boundary object function. For example, this call to polybool specifies the union operation as the first argument.

[Cx,Cy] = polybool('union',Ax,Ay,Bx,By)
To update this usage, create separate polyshape objects for each shape and then use the union object function associated with the polyshape object. polyshape supports the Boolean operations supported by polybool: union, intersection, subtraction, and exclusive OR. Use the polyshape boundary object function to return Cx and Cy. See polyshape for a complete list of object functions, including plot.
A = polyshape(Ax,Ay,'Simplify',false); 
B = polyshape(Bx,By,'Simplify',false); 
C = union(A,B);
[Cx,Cy] = boundary(C);
Note that the polygon vertex order is likely to differ between the output from polybool and the output from the call to boundary, because there is no single right answer. (Even in a simple one-region polygon, the vertices can be permuted cyclically without affecting the underlying geometry.) In addition, if the geometries of the inputs are not perfectly clean (free from self-intersections, etc.), then the polyshape union operation may make small changes that are not necessarily performed in polybool.