Combine Bubble Chart with Other Graphics in Geographic Axes
Combine a bubble chart with other graphics in a geographic axes by using the geoaxes and bubblechart functions. The geoaxes and bubblechart functions enable you to change the line width and transparency of the bubbles, specify the locations of the size and color legends, and add text and line annotations.
If you do not need these capabilities, then you can create a standalone geographic bubble chart by using the geobubble function. In some cases, the geobubble function is more convenient than the geoaxes and bubblechart functions. For example, in some cases, the function automatically adds legends to the chart. For an example that shows how to create a standalone geographic bubble chart, see Create Standalone Geographic Bubble Chart from Table Data.
Load Data
Read a table containing tsunami occurrences. Each table row represents a tsunami occurrence. The table variables include data about the tsunamis.
tsunamis = readtable("tsunamis.xlsx",TextType="string");
Extract the latitudes, longitudes, wave heights, and tsunami causes from the table. Replace missing causes with "Unknown Cause".
lat = tsunamis.Latitude;
lon = tsunamis.Longitude;
maxheight = tsunamis.MaxHeight;
cause = tsunamis.Cause;
cause = fillmissing(cause,"constant","Unknown Cause");
Set Up Map
This example creates a bubble chart with multiple legends. To manage the position of the geographic axes and the alignment of the legends, use a tiled chart layout with one tile.
figure
t = tiledlayout(1,1);
Place a geographic axes in the tile. Note that, unlike plotting functions such as geoplot and geoscatter, the geoaxes function does not replace existing content in the figure. Prepare to use the geographic axes with the bubblechart function by returning the geographic axes object in gx. Then, prepare to add multiple bubble charts to the axes by changing the hold state to on.
gx = geoaxes(t);
hold on
Create Bubble Chart
Display the tsunami data using multiple bubble charts. Prepare to add a legend of tsunami causes by creating separate bubble charts for each cause.
Create a graphics array to store the bubble chart objects. Then, for each unique cause:
Get the tsunami cause from the list of causes.
Find the indices that match the cause.
Create a bubble chart from the associated latitude and longitude coordinates. Specify the target using the geographic axes object. Specify the bubble sizes using the wave heights and the display name for the legend using the tsunami cause.
Store the bubble chart in the array.
b = gobjects(0);
causes = unique(cause);
for k = 1:length(causes)
    c = causes(k);    % get cause
    idx = cause == c; % find indices that match cause
    b(k) = bubblechart(gx,lat(idx),lon(idx), ...
        maxheight(idx),DisplayName=c); % create bubble chart for cause
end
The map uses the bubble colors to illustrate the tsunami causes and the bubble sizes to illustrate the wave heights. Add a title.
title("Tsunamis by Cause and Wave Height")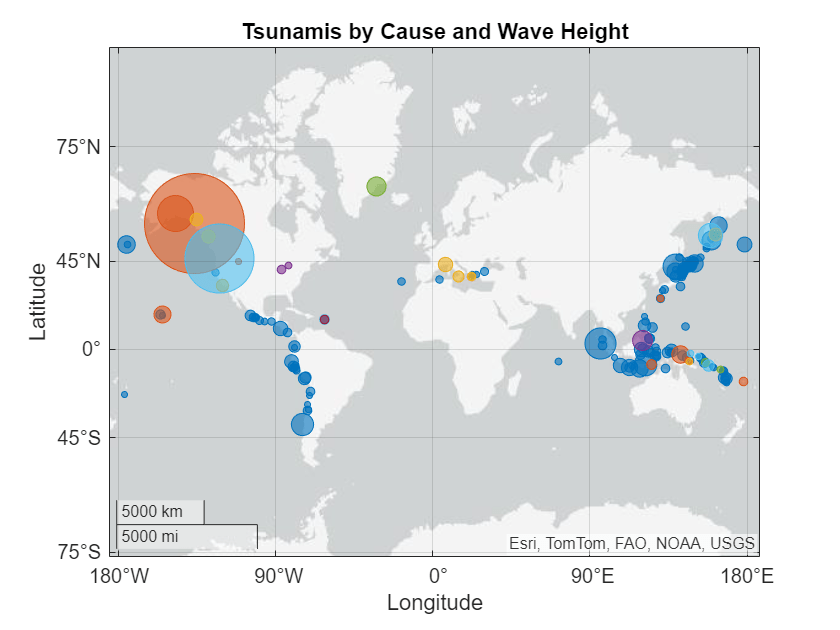
Add Color and Size Legends
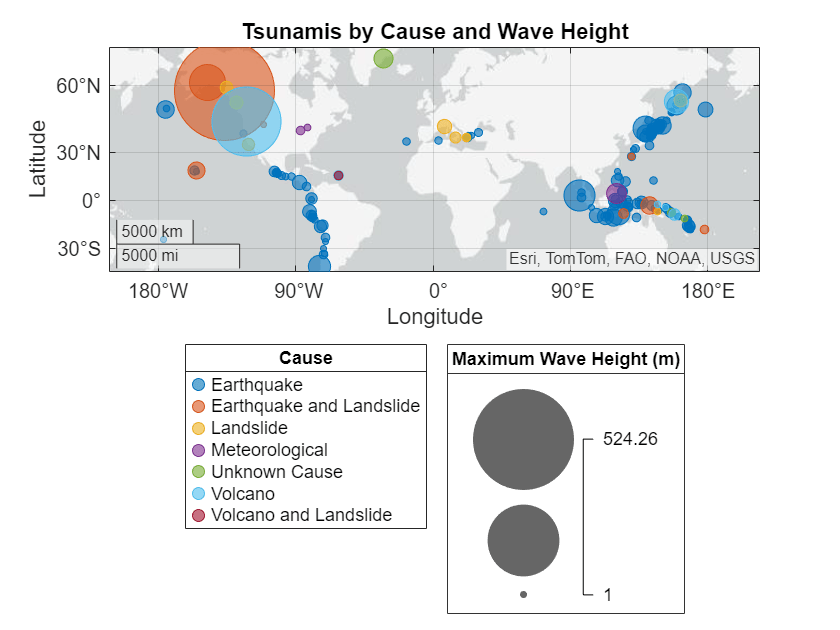
Add two legends to the map and store the legend objects in variables.
Add a legend that describes the bubble colors by using the
legendfunction. The legend populates the entries using the display names.Add a legend that describes the bubble sizes by using the
bubblelegendfunction.
lgd = legend;
title(lgd,"Cause")
blgd = bubblelegend("Maximum Wave Height (m)");
Move the legends to the left outer tile of the tiled chart layout by setting the Layout.Tile property of each legend object to "west".
lgd.Layout.Tile = "west";
blgd.Layout.Tile = "west";
Specify Bubble Sizes
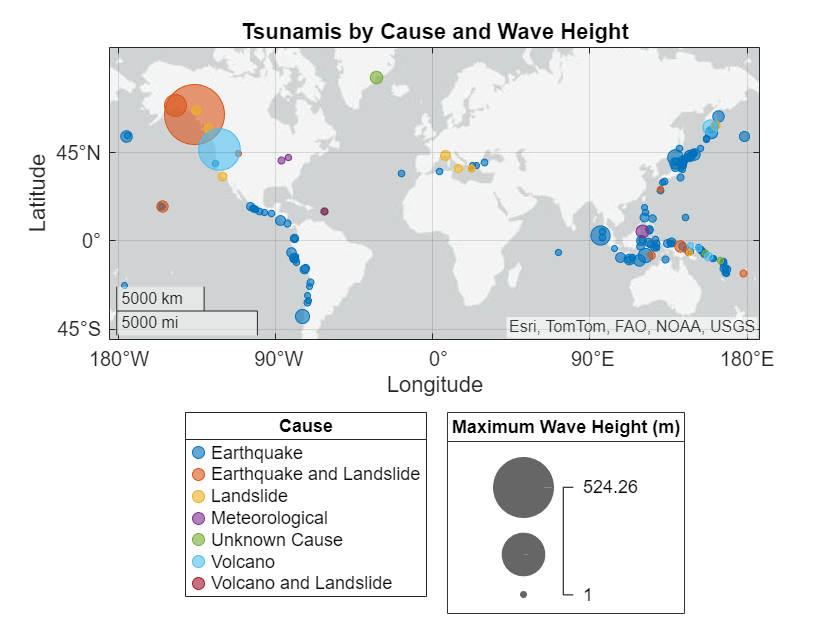
Set the sizes of the smallest and largest bubbles by using the bubblesize function. Change the bubble sizes so that they are between 3 and 30 points in diameter.
bubblesize([3 30])
Specify Bubble Colors
Change the bubble colors by using the colororder function and a predefined palette name.
colororder("dye")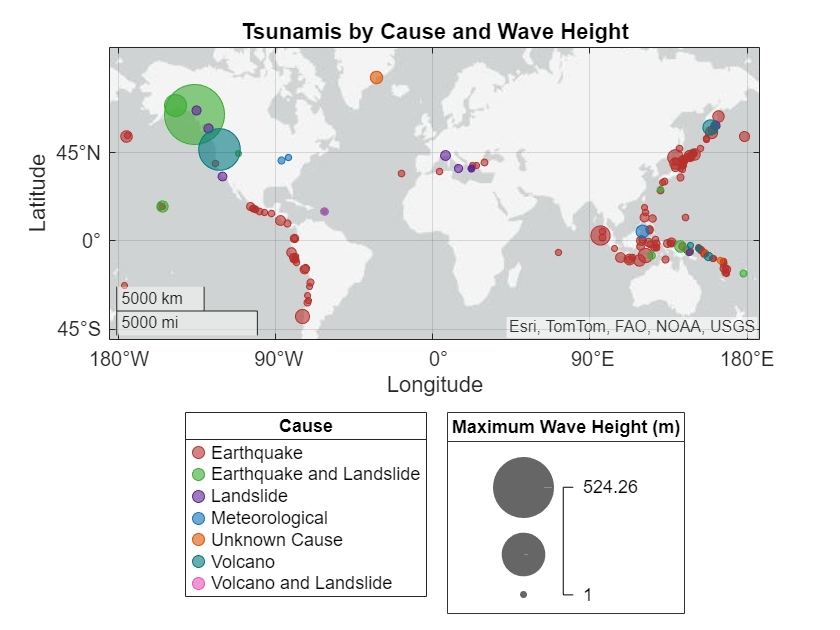
Change Line Width of Bubbles
Change the line width of the bubbles by setting the LineWidth property of the bubble chart objects. Update the property for all the bubble chart objects in the array by using the set function.
set(b,"LineWidth",1.2)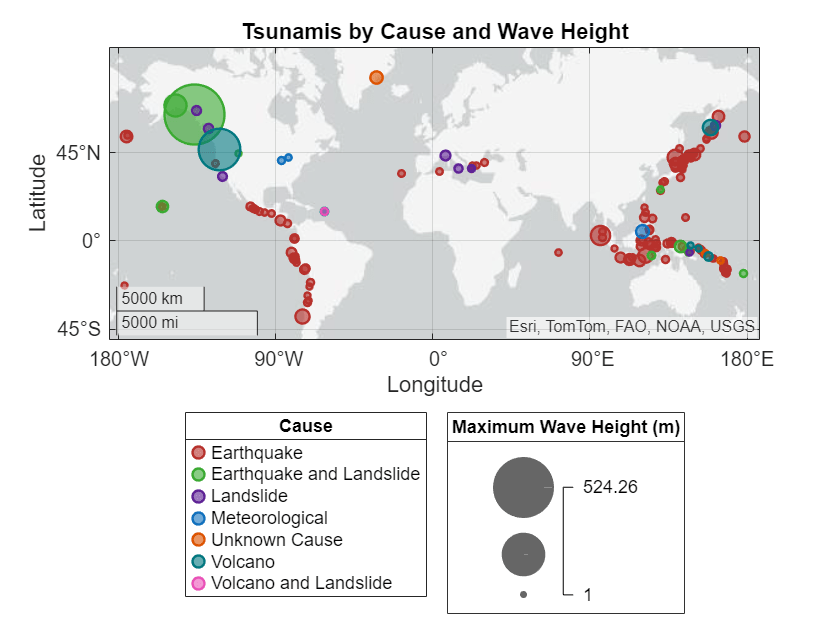
Change Transparency of Bubbles
Change the transparency of the bubble faces by setting the MarkerFaceAlpha property of the bubble chart objects. Make the bubble faces completely transparent by setting the property to 0.
set(b,"MarkerFaceAlpha",0)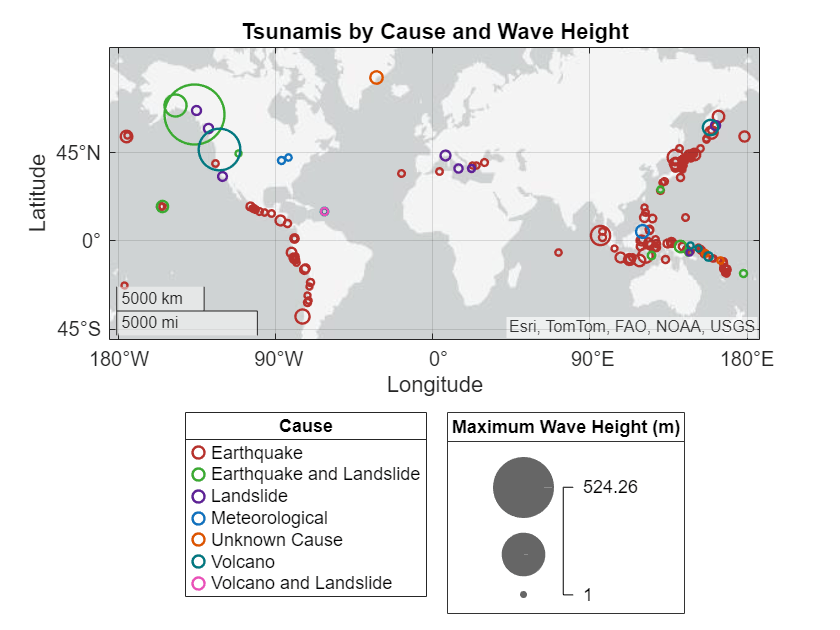
Add Text and Line Annotations
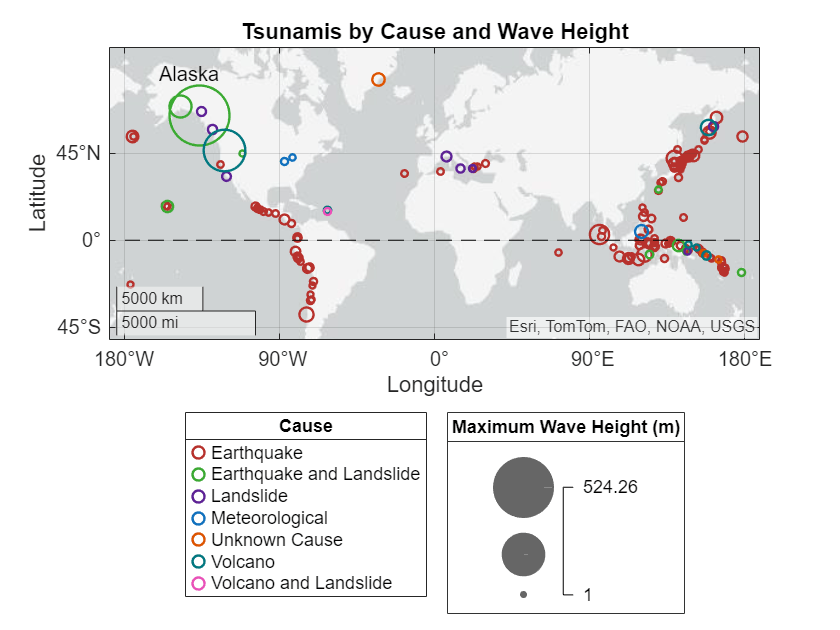
Add text to the map by using the text function. Specify the location for the text using latitude-longitude coordinates.
text(69,-160,"Alaska")Add a line annotation to the map by using the line function. Specify the line vertices using latitude-longitude coordinates. Avoid adding the line to the legend by setting the HandleVisibility property to "off".
line([0 0],[-180 180],Color="k",LineStyle="--",HandleVisibility="off")
See Also
Functions
geoaxes|bubblechart|legend|bubblelegend|bubblesize