帮助中心帮助中心
本页翻译不是最新的。点击此处可查看最新英文版本。
以磅为单位设置最小和最大气泡大小
自 R2020b 起
bubblesize(sizerange)
bubblesize(ax,sizerange)
sz = bubblesize
sz = bubblesize(ax)
示例
bubblesize(sizerange) 设置当前坐标区中气泡图的最小和最大气泡的大小。将 sizerange 指定为包含最小和最大直径的二元素向量,以磅为单位(1 磅 = 1/72 英寸)。
sizerange
bubblesize(ax,sizerange) 在 ax 指定的坐标区中设置气泡大小。
ax
sz = bubblesize 以包含最小和最大气泡直径的二元素向量形式返回当前坐标区的大小范围(以磅为单位)。
sz = bubblesize(ax) 返回 ax 指定的坐标区的大小范围。
sz
全部折叠
创建一个包含图例的气泡图。
x = 1:10; y = [4 7 10 7 3 6 5 1 9 7]; sz = [5 1 14 6 9 12 15 20 8 2]; bubblechart(x,y,sz); bubblelegend('Population','Location','northeastoutside')
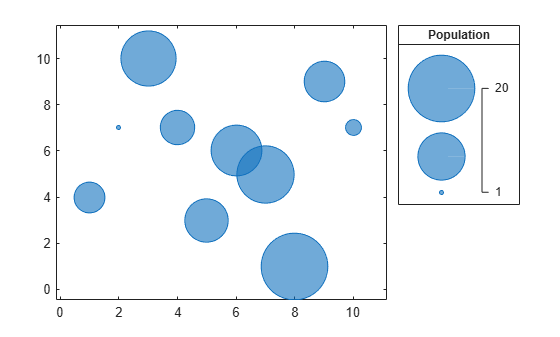
获取气泡大小的当前范围。
bubblesize
ans = 1×2 3 50
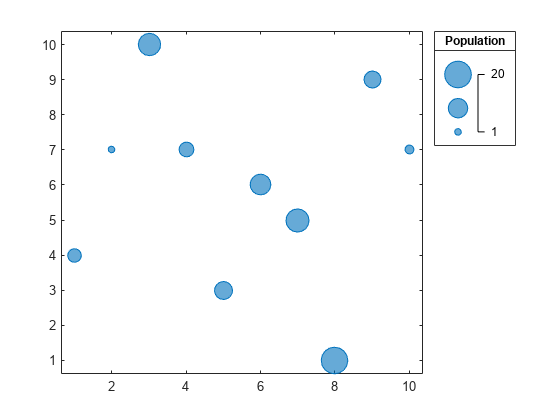
更改气泡大小,使其直径在 5 到 20 磅之间。气泡图例会自动更新以反映新气泡大小。
5
20
bubblesize([5 20])
创建两个数据集,然后创建一个包含两个气泡图的分块图布局。
% Create two sets of data x1 = 1:10; x2 = 1:50; y1 = rand(1,10); y2 = rand(1,50); sz1 = randperm(10,10); sz2 = randperm(50,50); % Create tiled chart layout t = tiledlayout(1,2); % Create bubble chart in first tile ax1 = nexttile; bubblechart(x1,y1,sz1) % Create bubble chart in first tile ax2 = nexttile; bubblechart(x2,y2,sz2)
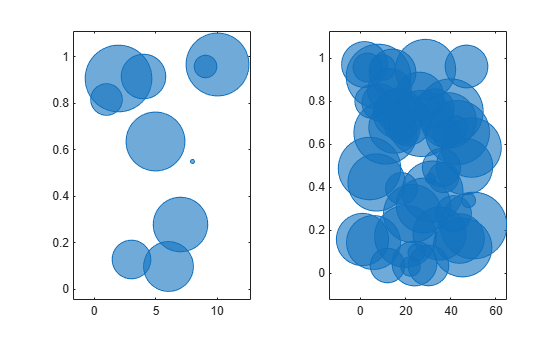
通过将 ax2 传递给 bubblesize 函数,查询右图中气泡大小的范围。
ax2
bubblesize(ax2)
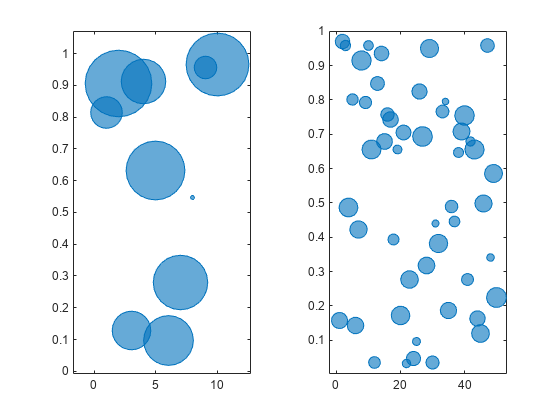
更改右图中的气泡大小,使其直径在 5 到 15 磅之间。
15
bubblesize(ax2,[5 15])
大小范围,指定为包含正数的二元素向量,其中第二个数大于第一个数。这两个数字分别指定最小和最大气泡大小,以磅为单位(1 磅 = 1/72 英寸)。
默认情况下,气泡图的大小范围为 [3 50]。
[3 50]
示例: bubblesize([20 70]) 将最小气泡大小设置为 20 磅,将最大气泡大小设置为 70 磅。
bubblesize([20 70])
Axes
PolarAxes
GeographicAxes
目标坐标区,指定为 Axes、PolarAxes 或 GeographicAxes 对象。
在 R2020b 中推出
bubblechart | bubblelim | bubblelegend
bubblechart
bubblelim
bubblelegend
您点击的链接对应于以下 MATLAB 命令:
请在 MATLAB 命令行窗口中直接输入以执行命令。Web 浏览器不支持 MATLAB 命令。
Select a Web Site
Choose a web site to get translated content where available and see local events and offers. Based on your location, we recommend that you select: .
You can also select a web site from the following list:
Select the China site (in Chinese or English) for best site performance. Other MathWorks country sites are not optimized for visits from your location.
Contact your local office