bubblelegend
为气泡图创建图例
语法
说明
bubblelegend 在当前坐标区中创建一个气泡图例。气泡图例有助于显示使用 bubblechart、bubblechart3 和 polarbubblechart 函数创建的图中气泡与大小数据之间的关系。
bubblelegend(___, 使用一个或多个名称-值对组参量来设置气泡图例属性。在所有其他输入参量后指定属性。Name,Value)
bubblelegend( 在指定的目标坐标区 ax,___)ax 中创建图例。在指定所有其他输入参量之前指定坐标区。
blgd = bubblelegend(___) 返回 BubbleLegend 对象。创建图例后,使用 blgd 修改图例的属性。有关属性列表,请参阅 BubbleLegend 属性。
示例
创建气泡图并添加气泡图例。
x = 1:10;
y = exp(-0.5*x) +  .05 * randn(1,10);
sz = randi([20 500],[1,10]);
bubblechart(x,y,sz)
bubblelegend('Population')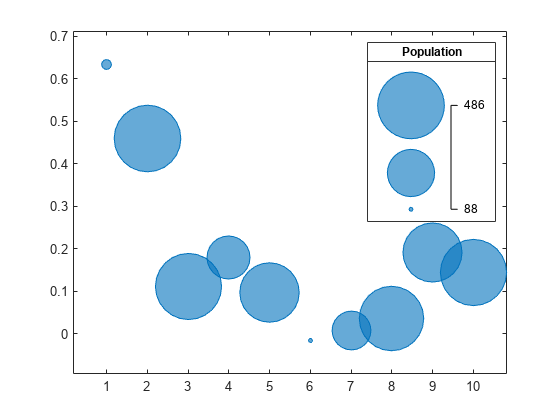
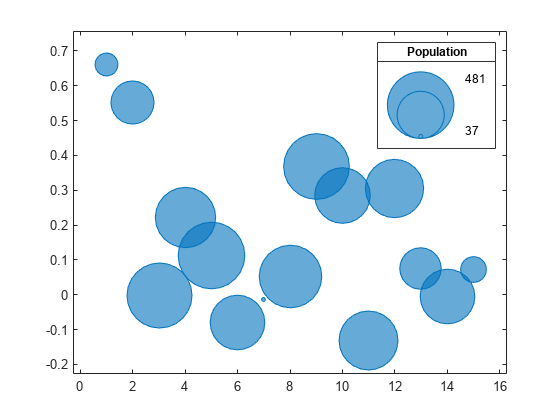
创建气泡图并添加气泡图例。指定 'telescopic' 样式,使显示更加紧凑。
x = 1:15;
y = exp(-0.5*x) +  .1 * randn(1,15);
sz = randi([20 500],[1,15]);
bubblechart(x,y,sz)
bubblelegend('Population','Style','telescopic');
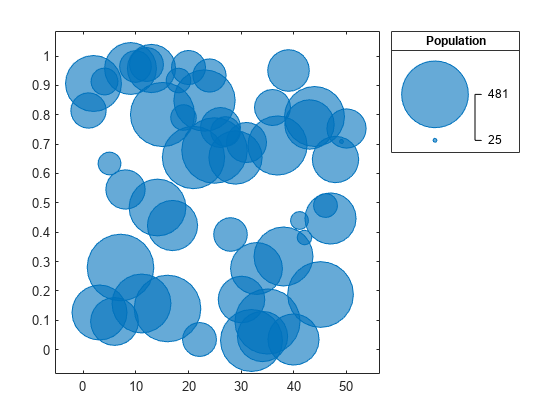
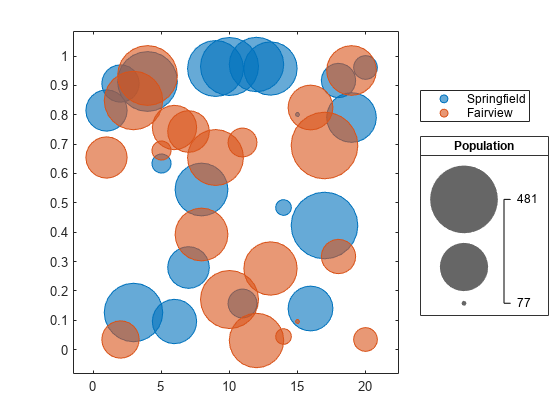
创建一个气泡图。然后调用带返回参量的 bubblelegend 函数,以将 BubbleLegend 对象存储为 blgd。通过将对象的 Location 属性设置为 'northeastoutside',将图例移出图框。通过将 NumBubbles 属性设置为 2,显示两个而不是三个气泡。
x = 1:50;
y = rand(1,50);
sz = randi([20 500],[1,50]);
bubblechart(x,y,sz)

% Create bubble legend and set properties
blgd = bubblelegend('Population');
blgd.Location = 'northeastoutside';
blgd.NumBubbles = 2;
当使用不同颜色或不同类型的绘图对象显示多个数据集时,可以包含多个图例。要管理图例的对齐,请在分块图布局中创建图。
创建两个数据集,并将它们绘制在分块图布局内的同一坐标区对象中。
x = 1:20;
y1 = rand(1,20);
y2 = rand(1,20);
sz1 = randi([20 500],[1,20]);
sz2 = randi([20 500],[1,20]);

% Plot data in a tiled chart layout
t = tiledlayout(1,1);
nexttile
bubblechart(x,y1,sz1)
hold on
bubblechart(x,y2,sz1)
hold off
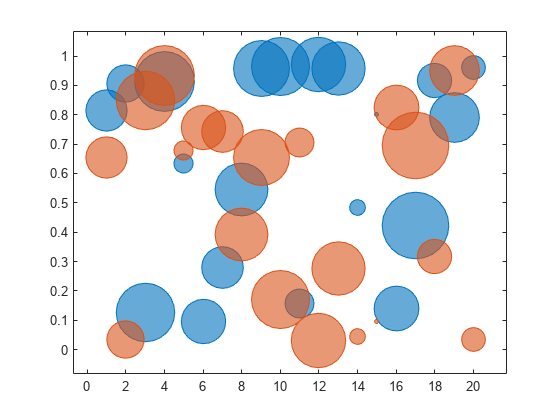
添加说明气泡大小的气泡图例,并添加另一个用于说明颜色的图例。带返回参量调用 bubblelegend 和 legend 函数来存储图例对象。通过将每个对象的 Layout.Tile 属性设置为 'east',将图例移至 east 图块。将图例放在一个图块中可以使它们保持对齐。
blgd = bubblelegend('Population');
lgd = legend('Springfield','Fairview');
blgd.Layout.Tile = 'east';
lgd.Layout.Tile = 'east';
输入参数
名称-值参数
将可选参量对组指定为 Name1=Value1,...,NameN=ValueN,其中 Name 是参量名称,Value 是对应的值。名称-值参量必须出现在其他参量之后,但对各个参量对组的顺序没有要求。
如果使用的是 R2021a 之前的版本,请使用逗号分隔每个名称和值,并用引号将 Name 引起来。
示例: bubblelegend('Style','telescopic') 创建一个嵌套图例。
注意
此处所列的属性只是一部分。有关完整列表,请参阅 BubbleLegend 属性。
相对于坐标区的位置,指定为下表中所列的位置值之一。
| 值 | 描述 |
|---|---|
'north' | 坐标区内侧上边缘。 |
'south' | 坐标区内侧下边缘。 |
'east' | 坐标区内侧右边缘。 |
'west' | 坐标区内侧左边缘。 |
'northeast' | 坐标区内侧右上角。 |
'northwest' | 坐标区内的左上角。 |
'southeast' | 坐标区内的右下角。 |
'southwest' | 坐标区内的左下角。 |
'northoutside' | 坐标区的上方。 |
'southoutside' | 坐标区的下方。 |
'eastoutside' | 到坐标区的右侧。 |
'westoutside' | 到坐标区的左侧。 |
'northeastoutside' | 坐标区外的右上角。 |
'northwestoutside' | 坐标区外的左上角。 |
'southeastoutside' | 坐标区外的右下角。 |
'southwestoutside' | 坐标区外的左下角 |
'layout' | 分块图布局中的图块。要将图例移至不同图块,请设置 Layout 属性。 |
'none' | 由 Position 属性确定的位置。可使用 Position 属性指定自定义位置。 |
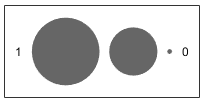
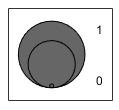
图例样式,指定为表中的值之一。表中的图像显示一个具有三个气泡的图例采用不同样式时的外观。
| 样式值 | 外观 |
|---|---|
'vertical' |
|
'horizontal' |
|
'telescopic' |
|
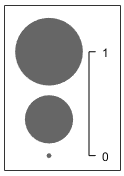
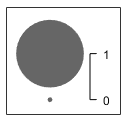
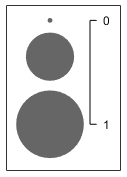
图例中显示的气泡的数量,指定为 2 或 3。下表显示具有 2 个和 3 个气泡的垂直气泡图例的外观。
| NumBubbles 值 | 外观 |
|---|---|
2 |
|
3 |
|
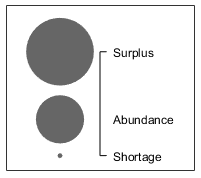
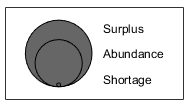
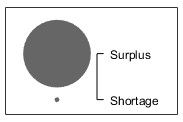
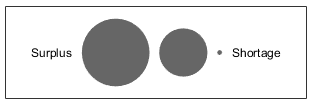
范围标签,指定为包含两个或三个元素的字符向量元胞数组或字符串数组。第一个标签出现在图例中最小气泡的旁边,最后一个标签出现在最大气泡的旁边。如果指定三个标签,则当图例是水平的或图例只有两个气泡时,第二个标签不会显示。下表显示了一些常见情形。
| 示例 | 结果 |
|---|---|
创建一个具有三个气泡的垂直图例,并指定三个范围标签。 blgd = bubblelegend;
blgd.LimitLabels = {'Shortage','Abundance','Surplus'}; |
|
创建一个具有三个气泡的嵌套图例,并指定三个范围标签。 blgd = bubblelegend('Style','telescopic'); blgd.LimitLabels = {'Shortage','Abundance','Surplus'}; |
|
创建一个具有两个气泡的垂直图例,并指定三个范围标签。 blgd = bubblelegend('NumBubbles',2); blgd.LimitLabels = {'Shortage','Abundance','Surplus'}; |
|
创建一个具有三个气泡的水平图例,并指定三个范围标签。 blgd = bubblelegend('Style','horizontal'); blgd.LimitLabels = {'Shortage','Abundance','Surplus'}; |
|
气泡大小的顺序,指定为表中的值之一。该表显示不同值对具有三个气泡的垂直图例的影响。
| BubbleSizeOrder 值 | 外观 |
|---|---|
'descending' |
|
'ascending' |
|
版本历史记录
在 R2020b 中推出