bubblelim
将气泡大小映射到数据范围
说明
bubblelim( 设置当前坐标区的气泡大小范围。将限制指定为 limits)[bmin bmax] 形式的二元素向量,其中 bmax 大于 bmin。设置范围时,坐标区中的最小气泡对应于 bmin,最大气泡对应于 bmax。例如,bubblelim([10 50]) 将最小和最大气泡分别映射到数据值 10 和 50。
lim = bubblelim 以二元素向量形式返回当前坐标区的气泡范围。
bubblelim( 支持以自动或手动模式来设置范围。将 modevalue)modevalue 指定为 'auto',以让 MATLAB® 根据所绘制数据的范围设置范围。指定 'manual' 以使范围保持当前值。
mv = bubblelim('mode') 返回当前气泡范围模式值,该值为 'auto' 或 'manual'。默认情况下,模式值为 'auto',除非您指定范围或将模式值设置为 'manual'。
示例
创建一个包含图例的气泡图。
x = 1:10;
y = [4 7 10 7 3 6 5 1 9 7];
sz = [5 1 14 6 9 12 15 20 8 2];
bubblechart(x,y,sz);
bubblelegend('Size Values','Location','northeastoutside')
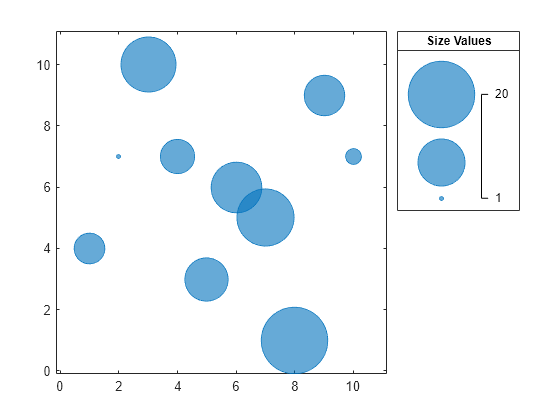
默认情况下,最小和最大气泡分别映射到 sz 向量中的最小和最大值。调用 bubblelim 函数以获取当前气泡范围。
bubblelim
ans = 1×2

     1    20
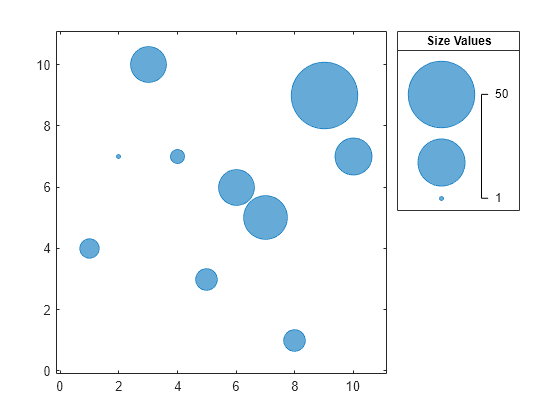
将范围更改为 [1 50]。结果,图中的气泡会变小,气泡图例中的标签会自动更新。
bubblelim([1 50])
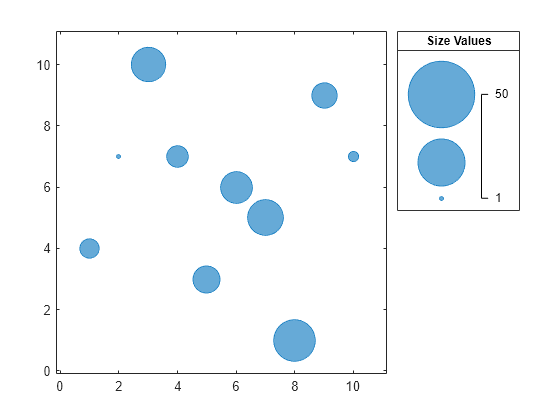
创建一个包含图例的气泡图。
x =  1:10;
y =  [4 7 10 7 3 6 5 1 9 7];
sz = [5 1 15 3 6 15 22 6 50 16];
bubblechart(x,y,sz);
bubblelegend('Size Values','Location','northeastoutside')
获得当前气泡范围。
bubblelim
ans = 1×2

     1    50
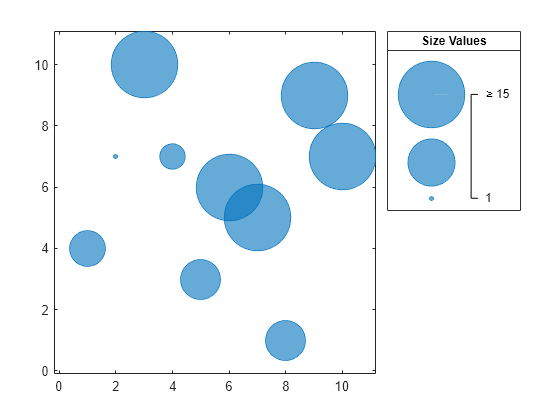
将范围更改为 [1 15]。结果,一些气泡会变大,并且任何 sz 值大于 15 的气泡都会被裁剪到最大气泡大小。气泡图例中的标签会自动更新。
bubblelim([1 15])
当您在同一坐标区内创建多个气泡图时,添加到坐标区的每个气泡图的气泡范围都会发生变化。它们会更改以适应所有图的 sz 值。要在绘图命令之间保持范围不变,请使用 bubblelim('manual') 命令。
例如,创建一个气泡图,其 sz 值的范围在 1 到 20 之间。
x =  1:10;
y1 =  [4 7 10 7 3 6 5 1 9 7];
sz1 = [5 1 14 6 9 12 15 20 8 2];
bubblechart(x,y1,sz1)
hold on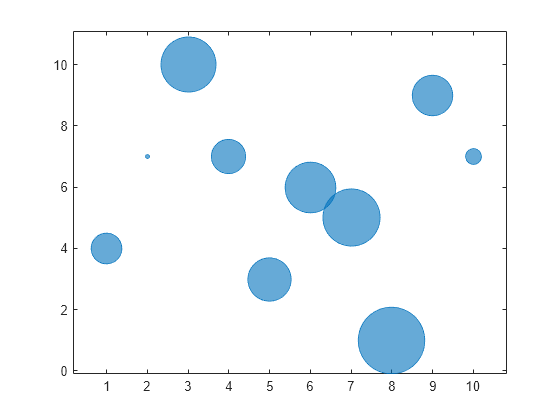
查询气泡范围。
bubblelim
ans = 1×2

     1    20
通过调用 bubblelim('manual') 命令使气泡范围保持当前值。创建另一个气泡图,其中 sz 值的范围在 1 到 50 之间。
bubblelim('manual')
y2 =  [10 7 2 3 8 9 2 1 3 4];
sz2 = [5 1 14 6 9 12 15 50 8 2];
bubblechart(x,y2,sz2);
再次查询气泡范围以验证它们没有更改。
bubblelim
ans = 1×2

     1    20
定义两个数据集,它们显示某大都市地区东西两侧不同城镇中某种毒素的污染水平。将 towns1 和 towns2 定义为城镇人口数。将 nsites1 和 nsites2 定义为对应城镇中工业场地的数量。然后将 levels1 和 levels2 定义为城镇中的污染水平。
towns1 = randi([25000 500000],[1 30]);
towns2 = towns1/3;
nsites1 = randi(10,1,30);
nsites2 = randi(10,1,30);
levels1 = (5 * nsites2) + (7 * randn(1,30) + 20);
levels2 = (3 * nsites1) + (7 * randn(1,30) + 20);
创建一个分块图布局,以便并排可视化数据。然后在第一个图块中创建一个坐标区对象,并绘制城市西侧的数据。添加标题和轴标签。然后,在第二个图块中重复以上过程来绘制东侧数据。
tiledlayout(1,2,'TileSpacing','compact')

% West side
ax1 = nexttile;
bubblechart(ax1,nsites1,levels1,towns1);
title('West Side')
xlabel('Number of Industrial Sites')

% East side
ax2 = nexttile;
bubblechart(ax2,nsites2,levels2,towns2);
title('East Side')
xlabel('Number of Industrial Sites')
ylabel('Contamination Level')
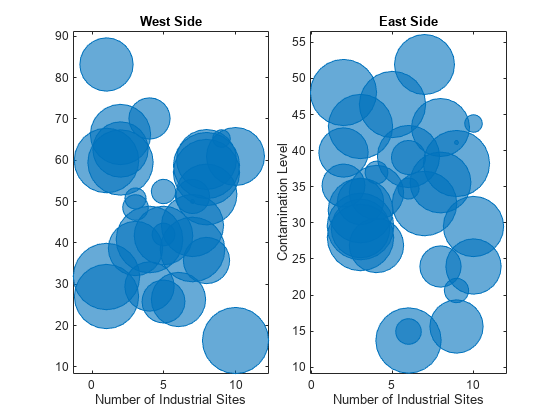
缩小所有气泡大小,以便更容易看到所有气泡。在本例中,将直径范围更改为介于 5 和 30 磅之间。
bubblesize(ax1,[5 30])
bubblesize(ax2,[5 30])
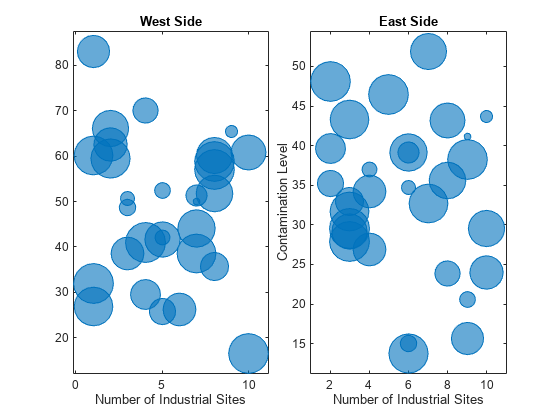
西区城镇的规模是东区城镇的三倍,但在前面的图中,气泡的大小并没有反映此信息。这是因为最小和最大的气泡映射到每个坐标区中最小和最大的数据点。要以相同的比例显示气泡,请定义名为 alltowns 的向量,其中包括城市两侧各自的人口数。使用 bubblelim 函数重置两个图的缩放比例。接下来,使用 xlim 和 ylim 函数显示具有相同 x 和 y 轴范围的图。
% Adjust scale of the bubbles
alltowns = [towns1 towns2];
newlims = [min(alltowns) max(alltowns)];
bubblelim(ax1,newlims)
bubblelim(ax2,newlims)

% Adjust x-axis limits
allx = [xlim(ax1) xlim(ax2)];
xmin = min(allx);
xmax = max(allx);
xlim([ax1 ax2],[xmin xmax]);

% Adjust y-axis limits
ally = [ylim(ax1) ylim(ax2)];
ymin = min(ally);
ymax = max(ally);
ylim([ax1 ax2],[ymin ymax]);

输入参数
版本历史记录
在 R2020b 中推出